无参De Nove组装通常用到Trinity软件,组装过程中最重要的两个参数就是--min_kmer_cov 和 --min_glue为组装出高质量结果我们通常需要去尝试用不同的参数,github上也有软件开发者讨论关于这两个参数Optimizing parameters可供参考,其实问题最终也就归结为你是否关心你数据中的低丰度转录本?
此外作者也提供了一系列方法来评估组装质量Transcriptome Assembly Quality Assessment总共列出6种方法可对不同参数的组装结果进行评估,看完后综合总结出其中4种评估方法。
Population Genetics
Glossary
Gene diversity
Gene diversity is a measure of the expected heterozygosity in a sample of gene copies collected at a single locus. It is a summary statistic used to represent patterns of molecular diversity within a sample of gene copies. Typically, the gene copies are allelic states such as allozymes or fragment sizes (e.g., RFLPs, AFLPs, microsatellites). The expected heterozygosity is caluclated under the assumption that the sample of gene copies was drawn from a population at Hardy-Weinberg equilibrium (HWE).
https://dendrome.ucdavis.edu/help/tutorials/gdiversity.php
程序运行报错总结
跑程序难免会遇到各种各样的错误,解决办法也多种多样,自此仅总结我所遇到的问题和最优的解决方案。
R报错
1 | >alphaData = read.csv("data.csv") |
Single Cell全基因组扩增
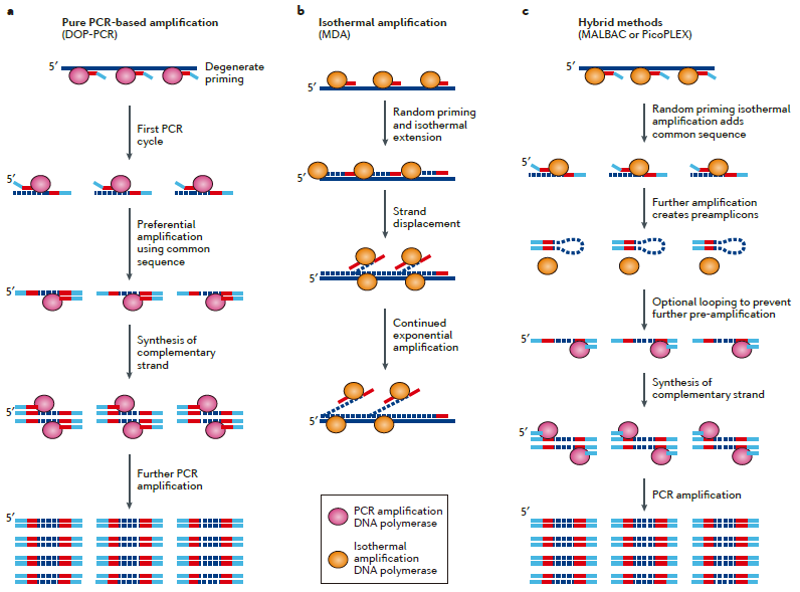
单细胞测序得以实现或者测序质量的提升得益于whole-genome amplification (WGA),WGA方法存在较大的扩增偏好性(偏好性来源于序列本身GC含量和非线性扩增过程),导致低的基因组覆盖度;
全基因组扩增WGA
目前主要存在有三种扩增方法:
简并寡核苷酸引物PCR扩增(DOP-PCR)、多重置换扩增反应(MDA)、置换预扩增和PCR扩增的组合(MALBAC)三种技术,各有优缺点。这些扩增方法可以把单细胞中pg级甚至fg级的DNA扩增至可满足测序的μg级样品量,正是这些技术的发明才使单细胞基因组测序成为可能。
ggplot2 2.2.0更新简要
ggplot2迎来更新,最新版本为2.2.0,同时也带来一些功能上是改进,详细原文见:ggplot2 2.2.0 coming soon!
最新版安装:1
2install.packages("devtools")
devtools::install_github("hadley/ggplot2")
主要更新内容如下:
Subtitles and captions(副标题和题注)
1 | ggplot(mpg, aes(displ, hwy)) + |

注:title现在默认为左对齐,想要居中,设置theme(plot.title = element_text(hjust = 0.5))
Facets分面
个人认为这个功能在ggplot2中效果不眨地,效果也不好,还不如坐标轴截断实际,但文章中认为坐标轴截断不科学-……—
坐标轴修改
改变坐标轴位置
1 | ggplot(mpg, aes(displ, hwy)) + |
添加双坐标轴sec.axis
1 | ggplot(mpg, aes(displ, hwy)) + |
主题
还记得以前画图时坐标轴间那挥之不去的空白吗,Now,他将不复存在。
箭头坐标轴element_line()
1 | #定义箭头 |
图例修改
图例可以与图形区对齐和添加外框。1
2
3
4
5
6
7ggplot(mpg, aes(displ, hwy, shape = drv, colour = fl)) +
geom_point() +
theme(
legend.justification = "top",
legend.box.margin = margin(3, 3, 3, 3, "mm"),
legend.box.background = element_rect(colour = "grey50")
)
注:panel.margin and legend.margin 重命名为 panel.spacing and legend.spacing 。
bars型图修改
新增geom_col()函数,相当于geom_bar(stat = “identity”)。
awk对table的统计计算
第三列相同时,第四列累加
1 | awk 'BEGIN{FS=OFS="\t"} \ |
awk中的数组由一对字符串组成,第一个字符串是‘index’,第二个是index所对应的value,a[$3]+=$4中的index来自第三列,value是第四列相应值的累加。
用asorti在awk中排序1
2
3
4awk 'BEGIN{FS=OFS="\t"} \
NR>1 \
{a[$3]+=$4} \
END {n=asorti(a,b);for (i=1;i<=n;i++) {print b[i],a[b[i]]}}' text.txt
依据第三列和第二列,第四列累加
1 | awk 'BEGIN{FS=OFS="\t"} \ |
第三列相同时,第四列的最大值
1 | awk -F, '{if (a[$1] < $2)a[$1]=$2;}END{for(i in a){print i,a[i];}}' OFS=, file.txt |
第三列相同值计数
1 | awk -F, '{a[$1]++;}END{for (i in a)print i, a[i];}' file.txt |
第三列相同时,仅输出第四列第一个值
1 | awk -F, '!a[$1]++' file.txt |
第三列相同时,第四列的所有值并未一行
1 | awk -F, '{if(a[$1])a[$1]=a[$1]":"$2; else a[$1]=$2;}END{for (i in a)print i, a[i];}' OFS=, file.txt |
参考资料
A Pivot Table In AWK
awk - 10 examples to group data in a CSV or text file
命令行生成数列:{}和seq
如何在命令行上产生一列数字呢?
在awk中的使用技巧:
1 | echo "$"$(seq -s ',$' 20) |
More:http://www.thelinuxrain.com/articles/building-sequences-of-numbers-on-the-command-line
table按条件合并
a.txt的第三列按照2.txt替换1
2
3
4
5
6
7
8
9
10
11
12
13
14cat a.txt
1 h 1 hhh
2 k 3 uytfd
3 d 2 gfsr
4 f 3 jdgk
cat b.txt
1 a
2 b
3 c
cat 预期结果
1 h a hhh
2 k c uytfd
3 d b gfsr
4 f c jdgk
join版
1 | join -t$'\t' -o 1.1 1.2 2.2 1.4 -1 3 -2 1 <(sort -k3 a.txt) b.txt | sort -n -k1 |
join命令:join -1 <file_1_field> -2 <file_2_field> <file_1> <file_2>
-a<1或2> 除了显示原来的输出内容之外,还显示指令文件中没有相同栏位的行。
-i或—igore-case 比较栏位内容时,忽略大小写的差异。
-t<字符> 使用栏位的分隔字符。
awk版
1 | awk 'BEGIN{FS=OFS=" "} NR==FNR {a[$1]=$2;next}{print $1,$2,a[$3],$4}' b.txt a.txt |
