ggplot2本身自带了很漂亮的主题格式,如theme_gray和theme_bw。但是在工作用图上,很多时候对图表格式配色字体等均有明文的规定。ggplot2允许我们事先定制好图表样式,我们可以生成如mytheme或者myline这样的有明确配色主题的对象,到时候就可以定制保存图表模板或者格式刷,直接在生成的图表里引用格式刷型的主题配色,就可以快捷方便的更改图表内容,保持风格的统一了。
画图前的准备:自定义ggplot2格式刷
1 | library(ggplot2) |
载入例子数据
1 | require(ggplot2) |
不用自定义格式画图
1 | ggplot(small)+geom_bar(aes(x=clarity, fill=cut))+coord_polar() |
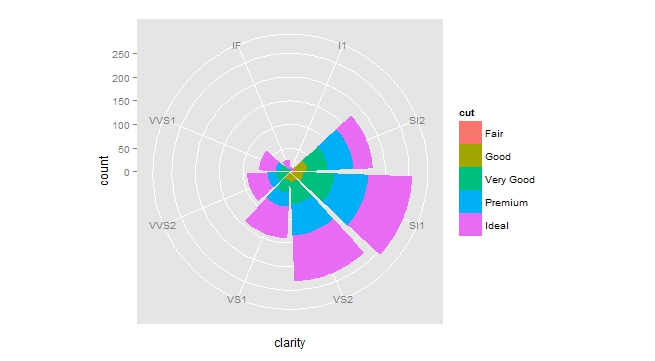
利用自定义格式画图
1 | ggplot(small)+geom_bar(aes(x=clarity, fill=cut))+coord_polar()+ mytheme + mytitle |

画图前的准备:数据塑形利器dplyr/tidyr
在R里,则是用一些常用的包,如dplyr及tidyr,基本用的都是reshape2+plyr的组合对数据进行重塑再造.
载入数据,数据来源: 股票的成交明细.
1 | > data<-read.table("gupiao.txt",header=TRUE) |
将数据汇总(group_by & summarize) 甚至再拆分 (spread)
示例里面就是把成交记录按照成交Price和BuySell拆分1
2
3
4
5
6
7
8
9
10
11
12
13
14
15
16
17> data %>% group_by(Price,BuySell) %>% summarize(Money=sum(Money,na.rm=TRUE)) %>% spread(BuySell,Money)
Source: local data frame [46 x 16]
Price -0.07 -0.06 -0.05 -0.04 -0.03 -0.02 -0.01 0 0.01
1 17.58 NA NA NA NA NA NA 41631769 29645465 NA
2 17.59 NA NA NA NA NA 17173618 37029276 NA 24179724
3 17.60 NA NA NA NA NA 318581 42756941 15987562 11197676
4 17.61 NA NA NA NA NA NA 58098336 36701330 14999088
5 17.62 NA NA NA NA NA NA 32385632 51156365 24341609
6 17.63 NA NA NA NA NA 5191027 16112558 32054647 23599759
7 17.64 NA NA NA 24642084 3725529 14682967 4791698 18864232 4731619
8 17.65 NA NA NA NA 3918096 6003983 16293279 19115145 13177514
9 17.66 NA NA NA NA 5175002 NA 54169855 16671362 7801764
10 17.67 NA NA NA NA NA 10951987 38090607 8704892 7911066
.. ... ... ... ... ... ... ... ... ... ...
Variables not shown: 0.02 (int), 0.03 (int), 0.04 (int), 0.05 (int), 0.06 (int),
0.07 (int)
然后便可用ggplot等包绘图。
常用图形
1 | 简单柱形图+文本(单一变量) |
1)简单柱形图

代码组成如下,这里使用格式刷mybar和mytheme,然后用geom_text添加柱形图标签(vjust=1表示在柱形图里面显示)1
2
3
4
5data1<-diamonds %>% group_by(cut) %>% summarize(avg_price=mean(price))
bar_chart<-ggplot(data1,aes(x=cut,y=avg_price,fill=as.factor(cut)))+
mybar+mytheme+mytitle+
geom_text(aes(label=round(avg_price)),vjust=1,colour="white")
bar_chart
2)带分类的柱形图
使用facet_wrap或者facet_grid可以快速绘制相应图形。这也是ggplot2不太支持双坐标的原因:可以快速绘图,就不需要做那么多无用功了。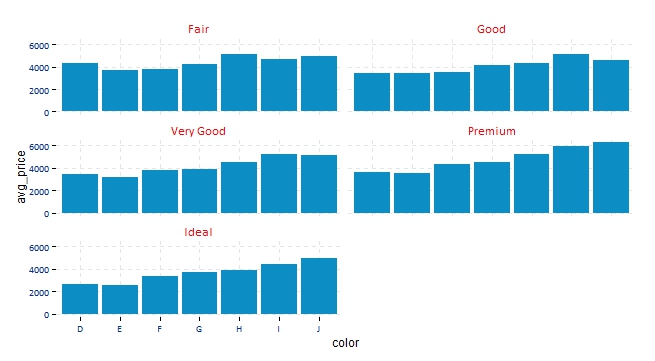
代码如下:1
2
3
4
5
6#dplyr处理数据
data2<-diamonds %>% group_by(cut,color) %>% summarize(avg_price=mean(price))
#画图,套用设定好的绘图元素
ggplot(data2,aes(x=color,y=avg_price))+facet_wrap(~cut,ncol = 2)+
mybar+mytheme+mytitle
#在facet_wrap里面,如果加上scales="free"的话,坐标就不一样了。
3)簇型图
制图要点是,对数据作图后,添加geom_bar时,position=”dodge”(分开的)如果去掉这部分,默认是生成堆积图.

代码如下:
1 | data3<-diamonds %>% filter(cut %in% c("Fair","Very Good","Ideal")) %>% |
这里如果想要定义颜色的相应顺序的话,可以使用factor
譬如以下,只是用这行代码对颜色重新定义一下,用levels改变factor顺序,再画图的时候,颜色以及柱子顺序就会跟着改变了。非常方便。1
data3$cut<-factor(data3$cut,levels=c("Very Good","Ideal","Fair"))
4)百分比堆积图
制图前要事先添加一个百分比的数据之后才好作图,这里我们用mutate(percent=n/sum(n))添加该百分比数据。同时去掉position=”dodge”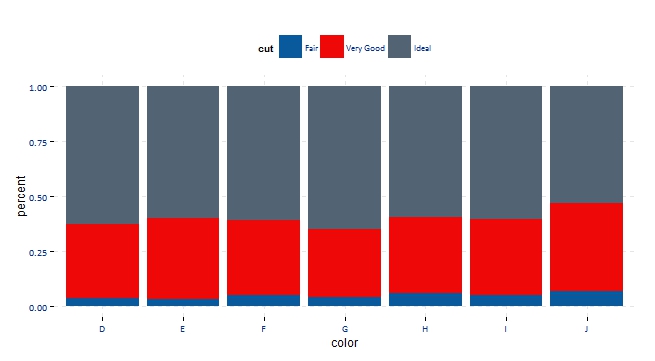
1
2
3
4
5data4<-diamonds %>% filter(cut %in% c("Fair","Very Good","Ideal")) %>%
count(color,cut) %>%
mutate(percent=n/sum(n))
堆积图<-ggplot(data4,aes(x=color,y=percent,fill=cut))+mytitle+
geom_bar(stat="identity")+mytheme+mycolour_3
当然,也可以做面积图。不过如果数据有缺失,面积图出错几率蛮大的
5)饼图以及极坐标图
在ggplot2里并没有直接画饼图的方法,基本上都是先画出柱形图,再用coord_polar转化为饼图.
不指定x轴,直接用geom_bar生成y轴,然后fill=分类颜色,coord_polar直接投影y轴,该方法的好处代码是比较简单:coord_polar(“y”) 。
加标签方法请见: http://stackoverflow.com/questions/8952077/pie-plot-getting-its-text-on-top-of-each-other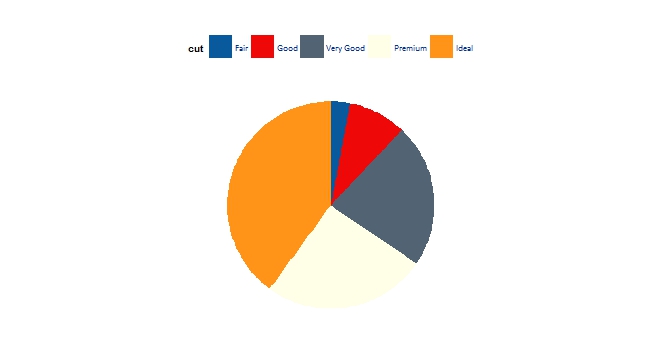
1
2
3
4
data5<-diamonds %>% count(cut) %>%
mutate(percent=n/sum(n))
ggplot(data5,aes(x=factor(1),y=percent,fill=cut))+geom_bar(stat="identity",width=3)+mycolour_7+
coord_polar("y")+pie_theme+mytitle
6、折线图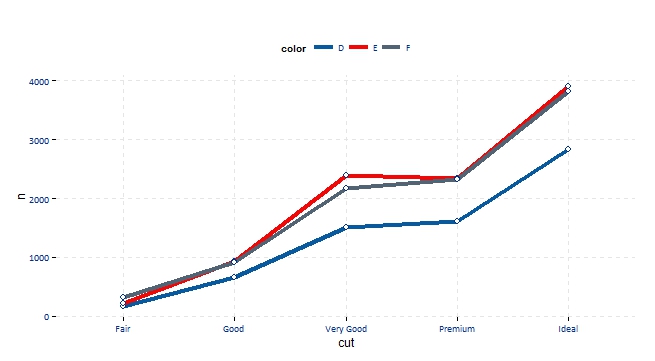
要点是,先做成如A-B-变量这样的二联表,然后,x轴为A,group为b,colour为b
下面代码展示了这个处理
如果去掉group的话,折线图会不知道怎么去处理数字。1
2
3
4data6<-diamonds %>% count(color,cut) %>% filter(color %in% c("D","E","F"))%>%
mutate(percent=n/sum(n))
ggplot(data6,aes(x=cut,y=n,group=color,colour=color))+geom_line(size=1.5)+mypoint+
mycolour_line_7+mytheme+mytitle
