原图:http://www.economist.com/node/21541178
ggplot2绘图语法结构:
1 | ggplot(data = <default data set>, |
Geometric Objects(geom_XX) and Aesthetics (aes())
1 | geom_<tab>查看所有Geometric Objects(几何学对象) |
Statistical Transformations(统计变换)
统计变换 (stat_) 比如求均值,求方差等,当我们需要展示出某个变量的某种统计特征的时候,需要用到统计变换。
每一个geom_XX都有一个默认的统计量,可通过args(geom_XX)查看(args(stat_bin))例如geom_bar的默认统计量是stat_count,表示进行计数。什么意思呢?举例如下:1
2
3
4
5
6
7
8
9
10
11
12
13
14
15
16
17> library(ggplot2)
> df <- data.frame(trt = c("a","a", "b", "c"), outcome = c(2.3,5, 1.9, 3.2))
> df
trt outcome
1 a 2.3
2 a 5.0
3 b 1.9
4 c 3.2
> ##stat()
> ggplot(df, aes(trt, outcome)) +
geom_bar()
Error: stat_count() must not be used with a y aesthetic.
#成功报错,因为第一句aes()中我们指定了y轴为outcome,即一个x轴的trt值对应一个y轴的outcome值,而geom_bar()
#中stat_count要进行计数,即计数trt中相同值出现的次数.最终y轴指定的outcome与需要表示的count值冲突,报错。
##解决:
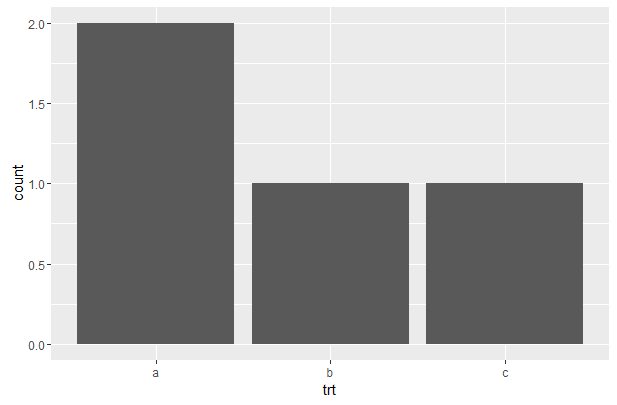
> ggplot(df, aes(trt)) +
geom_bar()
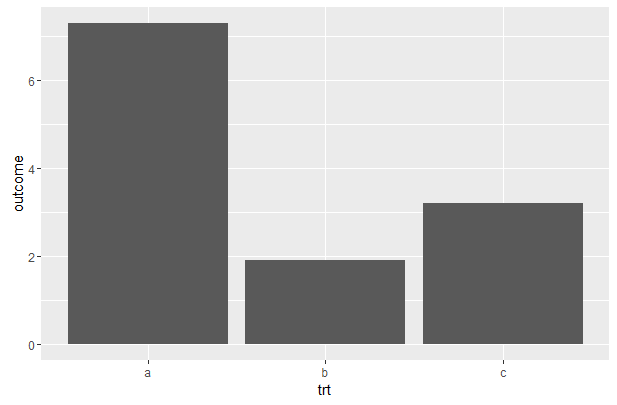
如果想要表示相同trt值相加后的对应值,修改stat=indentity即可。1
2> ggplot(df, aes(trt, outcome)) +
+ geom_bar(stat = "identity")
ggplot2中包含的统计变换有如下多种:
更多参见:https://www.zhihu.com/question/24779017
Scales
控制aes()映射
Aesthetic (aes()) 映射仅仅是告诉一个变量应该映射到一个aesthetic,但并没有说明如何映射?例如,当我们用aes(shape=x)去映射一个变量到shape时,并没有说明用什么shape;同样的,aes(color=z)并无说明用什么颜色;通常在我们未定义这些时ggplot2会自动用默认值,而我们可以通过scale来修改这些值。
在ggplot2中scales包括:
### 修改方式
1 | scale_<aesthetic>_<type>(name,limits,breaks,labels) |
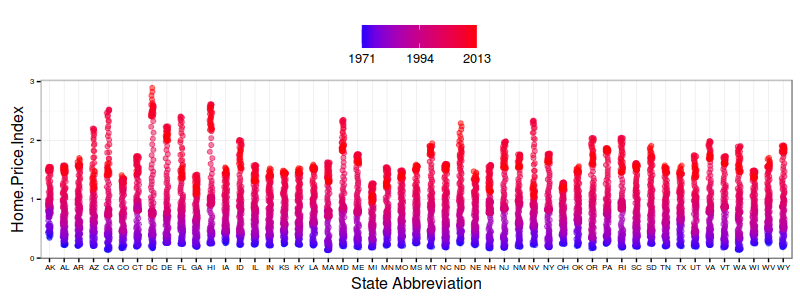
特殊scale函数有额外参数,例如对颜色的修改
scale_color_continuous函数有low和high参数。1 | scale_x_discrete(name="State Abbreviation") + |
## Faceting
### 分面: 一页多图
facet_wrap():对数据分类只能应用一个标准,例facet_wrap(~State, ncol = 10)),按State分组后每行设置10个小图依次画出全部。facet_grid():多个标准对数据进行分组绘图,facet_grid(color~cut,margins=TRUE),波浪号前为小图分行标准,后面为分列标准,margins指用于分面的包含每个变量元素所有数据的数据组,相当于每个小图一个title。## Themes
### 主题
更多ggplot2主题演示如下:
http://docs.ggplot2.org/dev/vignettes/themes.html
https://github.com/jrnold/ggthemes
### 修改主题默认值
1 | theme_minimal() + |
### 自定义主题
1 | theme_new <- theme_bw() + |
## 关于晕晕的aes()
##其他总结