数据类型
宽数据1
2
3
4
5# ozone wind temp
# 1 23.62 11.623 65.55
# 2 29.44 10.267 79.10
# 3 59.12 8.942 83.90
# 4 59.96 8.794 83.97
长数据1
2
3
4
5
6
7
8
9
10
11
12
13# variable value
# 1 ozone 23.615
# 2 ozone 29.444
# 3 ozone 59.115
# 4 ozone 59.962
# 5 wind 11.623
# 6 wind 10.267
# 7 wind 8.942
# 8 wind 8.794
# 9 temp 65.548
# 10 temp 79.100
# 11 temp 83.903
# 12 temp 83.968
长数据有一列数据是变量的类型,有一列是变量的值。长数据不一定只有两列。ggplot2需要长类型的数据,plyr也需要长类型的数据,大多数的模型(比如lm(), glm()以及gam())也需要长数据。
reshape2 包
reshape2 用得比较多的是melt和cast两个函数。
melt函数对宽数据进行处理,得到长数据;
cast函数对长数据进行处理,得到宽数据;
melt函数
melt(参数)1
2
3melt(data,id.vars,measure.vars,
variable.name = "variable", ..., na.rm = FALSE,
value.name = "value")
其中id.vars可以指定一系列变量,然后measure.vars就可以留空了,这样生成的新数据会保留id.vars的所有列,然后增加两个新列:variable和value,一个存储变量的名称一个存储变量值。
此处用R内置的airquality数据集1
2
3
4
5
6
7
8> head(airquality)
Ozone Solar.R Wind Temp Month Day
1 41 190 7.4 67 5 1
2 36 118 8.0 72 5 2
3 12 149 12.6 74 5 3
4 18 313 11.5 62 5 4
5 NA NA 14.3 56 5 5
6 28 NA 14.9 66 5 6
首先将列名改成小写,然后查看相应的数据1
2
3
4
5
6
7
8
9
10
11
12
13
14
15
16
17
18
19
20
21
22
23
24
25
26
27
28
29> names(airquality)<- tolower(names(airquality))
> head(airquality)
ozone solar.r wind temp month day
1 41 190 7.4 67 5 1
2 36 118 8.0 72 5 2
3 12 149 12.6 74 5 3
4 18 313 11.5 62 5 4
5 NA NA 14.3 56 5 5
6 28 NA 14.9 66 5 6
##直接用metl函数处理上述的数据
> library("reshape2")
> aql <- melt(airquality)
No id variables; using all as measure variables
> head(aql)
variable value
1 ozone 41
2 ozone 36
3 ozone 12
4 ozone 18
5 ozone NA
6 ozone 28
> tail(aql)
variable value
913 day 25
914 day 26
915 day 27
916 day 28
917 day 29
918 day 30
默认情况下,melt认为所有数值列的变量均有值。很多情况下,这都是我们想要的情况。在这里,我们想知道每个月(month)以及每天(day)的ozone, solar.r, wind以及temp的值。因此,我们需要告诉melt,month和day是”ID variables”。ID variables就是那些能够区分不同行数据的变量,个人感觉类似于数据库中的主键。1
2
3
4
5
6
7
8
9> aql <- melt(airquality, id.vars = c("month", "day"))
> head(aql)
month day variable value
1 5 1 ozone 41
2 5 2 ozone 36
3 5 3 ozone 12
4 5 4 ozone 18
5 5 5 ozone NA
6 5 6 ozone 28
如果我们想修改长数据中的列名,该如何操作呢?1
2
3
4
5
6
7
8
9
10
11> aql <- melt(airquality, id.vars = c("month", "day"),
+ variable.name = "climate_variable",
+ value.name = "climate_value")
> head(aql)
month day climate_variable climate_value
1 5 1 ozone 41
2 5 2 ozone 36
3 5 3 ozone 12
4 5 4 ozone 18
5 5 5 ozone NA
6 5 6 ozone 28
cast函数
从宽格式数据变换到长格式的数据比较直观,然后反过来则需要一些二外的功夫。
在reshape2中有好几个cast版本的函数。若你经常使用data.frame,就需要使用dcast函数。acast函数返回向量、矩阵或者数组。
dcast借助于公式来描述数据的形状,左边参数表示”ID variables”,而右边的参数表示measured variables。可能需要几次尝试,才能找到合适的公式。
这里,我们需要告知dcast,month和day是ID variables,variable则表示measured variables。1
2
3
4
5
6
7
8
9
10
11
12
13
14
15
16
17
18> aql <- melt(airquality, id.vars = c("month", "day"))
> aqw <- dcast(aql, month + day ~ variable)
> head(aqw)
month day ozone solar.r wind temp
1 5 1 41 190 7.4 67
2 5 2 36 118 8.0 72
3 5 3 12 149 12.6 74
4 5 4 18 313 11.5 62
5 5 5 NA NA 14.3 56
6 5 6 28 NA 14.9 66
> head(airquality) # 与原始数据比较
ozone solar.r wind temp month day
1 41 190 7.4 67 5 1
2 36 118 8.0 72 5 2
3 12 149 12.6 74 5 3
4 18 313 11.5 62 5 4
5 NA NA 14.3 56 5 5
6 28 NA 14.9 66 5 6
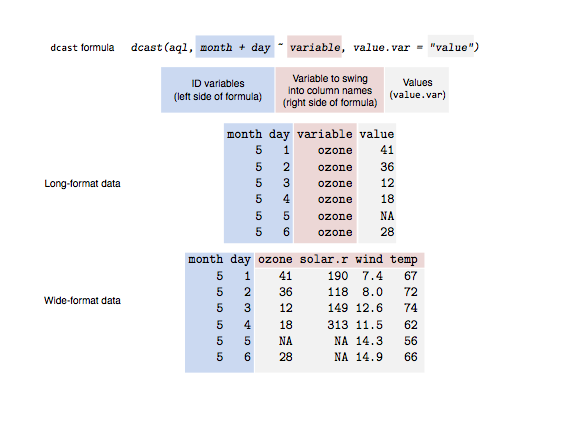
If it isn’t clear to you what just happened there, then have a look at this illustration:
蓝色阴影块是能够表示每一行数据的ID variables;红色阴影块包含了将待生成数据的列名;而灰色的数据表示用于填充相关区域的数据。
令人产生疑惑的情况往往是,一个数据单元有一个以上的数据。比如,我们的ID variables不包含day,1
2
3
4
5
6
7
8> dcast(aql, month ~ variable)
Aggregation function missing: defaulting to length
month ozone solar.r wind temp
1 5 31 31 31 31
2 6 30 30 30 30
3 7 31 31 31 31
4 8 31 31 31 31
5 9 30 30 30 30
再次查看dcast的输出数据,可以看到每个单元是month与climate组合的个数。所得到数据是month对应的day的记录数。当每个单元有多个数据是,需要告诉dcast如何聚合(aggregate)这些数据,比如取均值(mean),计算中位数(median),或者简单的求和(sum)。比如,在这里,我们简单的计算下均值,同时通过na.rm = TRUE删除NA值。1
2
3
4
5
6
7> dcast(aql, month ~ variable, fun.aggregate = mean, na.rm = TRUE)
month ozone solar.r wind temp
1 5 23.61538 181.2963 11.622581 65.54839
2 6 29.44444 190.1667 10.266667 79.10000
3 7 59.11538 216.4839 8.941935 83.90323
4 8 59.96154 171.8571 8.793548 83.96774
5 9 31.44828 167.4333 10.180000 76.90000
Additional help
Read the package help:help(package = "reshape2")
See the reshape2 website:
http://had.co.nz/reshape/
And read the paper on reshape:
Wickham, H. (2007). Reshaping data with the reshape package.
21(12):1–20.
http://www.jstatsoft.org/v21/i12
(But note that the paper is written for the reshape package not thereshape2 package.)
