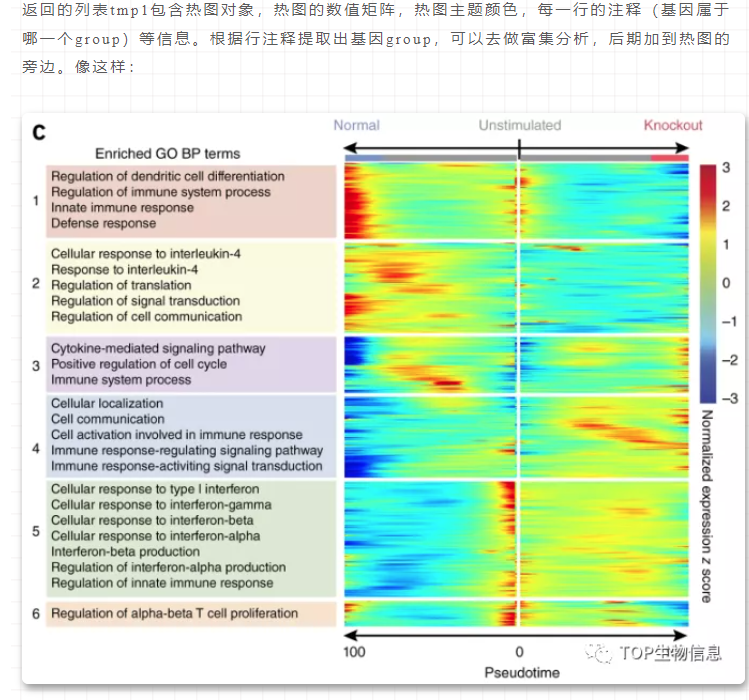
1. KEGG bubble plot
1
2
3
4
5
6
7
8
9
10
11
12
13
14
15
16
17
18
19
20
21
22
23
24
25
26
27
28setwd("C:/Users/hope/Desktop/Bio-scripts/R")
library(tidyverse)
library(ggplot2)
data = read.csv("LXY.csv",quote="",header = T)
head(data)
########
KEGG PATHWAY Total Hits Rich factor P-value Impact
Aminoacyl-tRNA biosynthesis 67 11 0.164179104 5.34E-05 0.09302
Flavonoid biosynthesis 43 6 0.139534884 0.0075289 0.21899
Ascorbate and aldarate metabolism 15 3 0.2 0.022171 0
Glyoxylate and dicarboxylate metabolism 17 3 0.176470588 0.031228 0.40476
########
kegg = data[,c(1,3,4,5)]
kg = transmute(kegg,KEGG.PATHWAY,Hits,Rich_factor=Rich.factor,P.value)
mid <- mean(kg$P.value)
ggplot(kg,aes(x = Rich_factor, y = KEGG.PATHWAY, size = Hits)) +
geom_point(aes(col=P.value),alpha=0.8) +
ggtitle("Statistics of Pathway Enrichment") +
labs(x = "Rich factor", y = "",size = "metabolism\n number", col = "p-value") +
scale_colour_gradient2(midpoint = mid, low = "red", mid = "green",
high = "purple")+
scale_size(range = c(2,10)) +
theme_bw() +
theme()
ggsave("KEGG.svg", width = 10, height = 8)
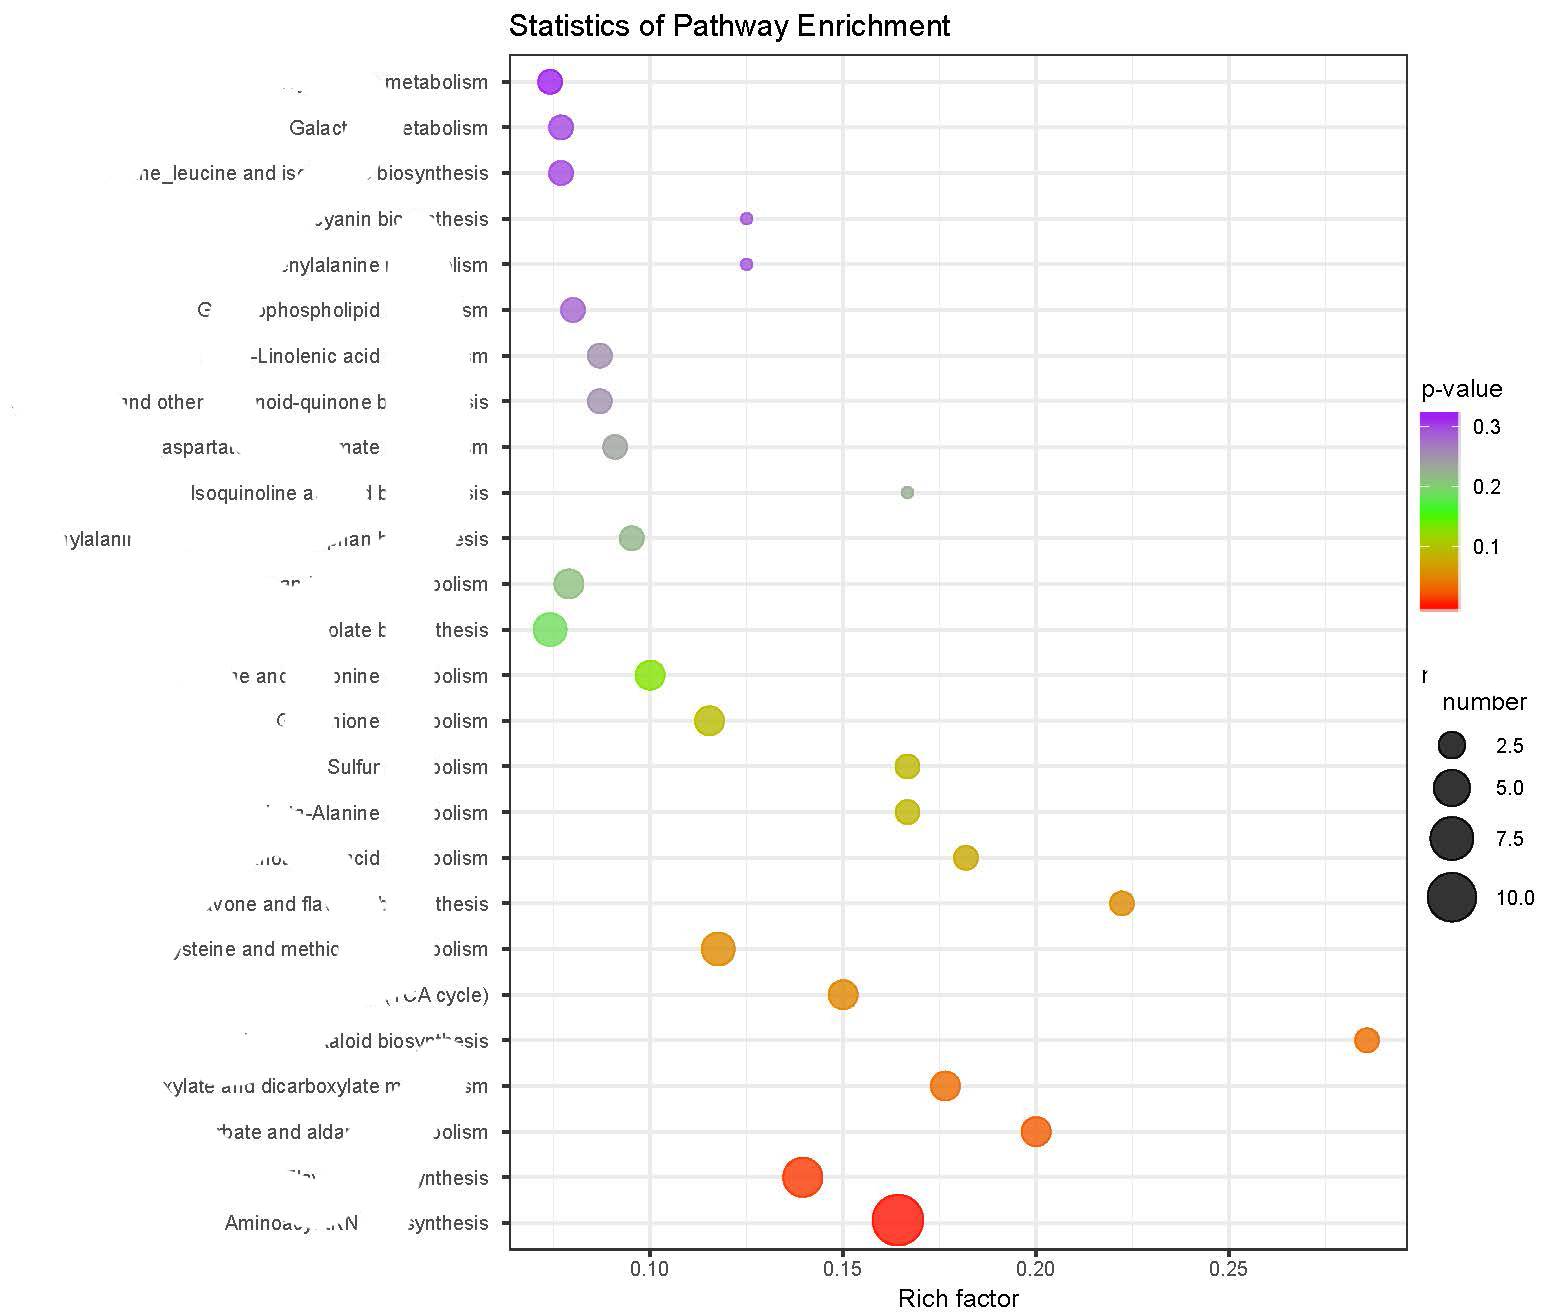
2. Genome_Scripts: A repository for scripts used in genome project
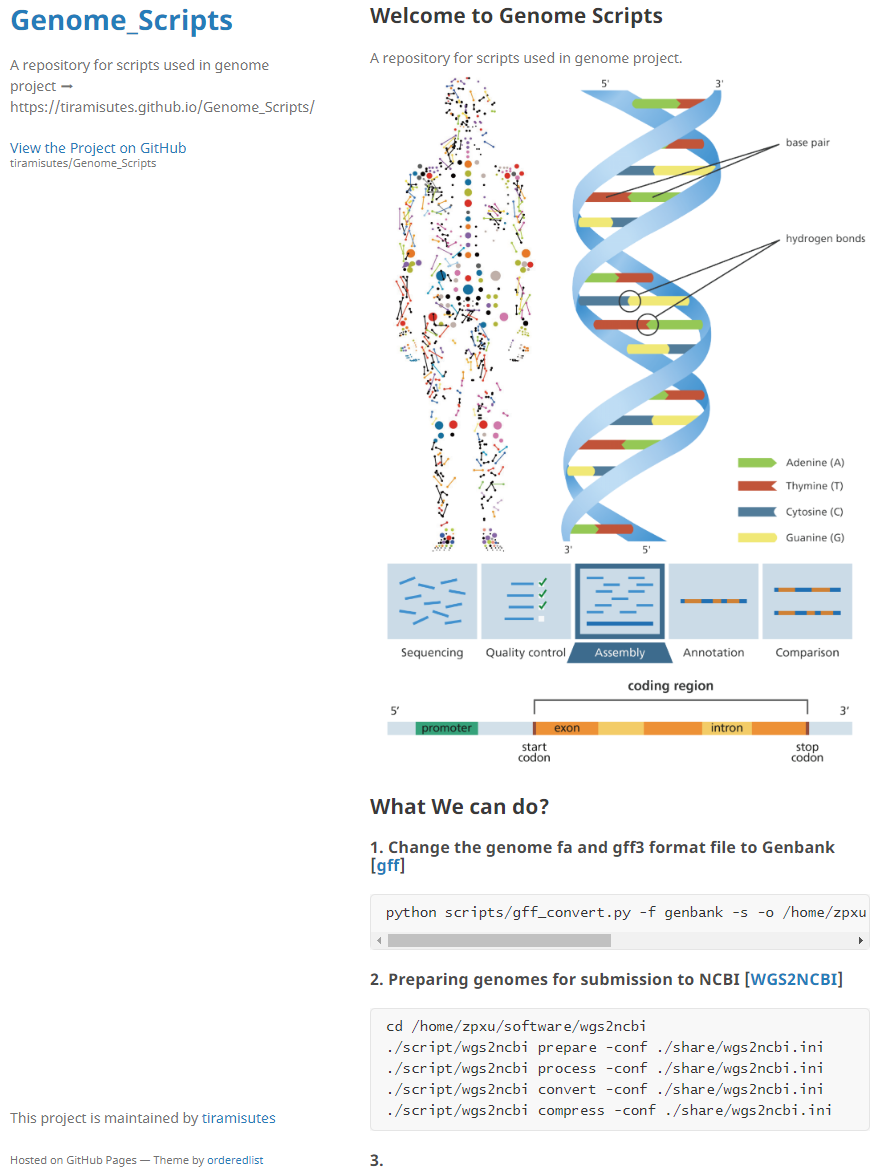
3. Figure for genome of black pepper
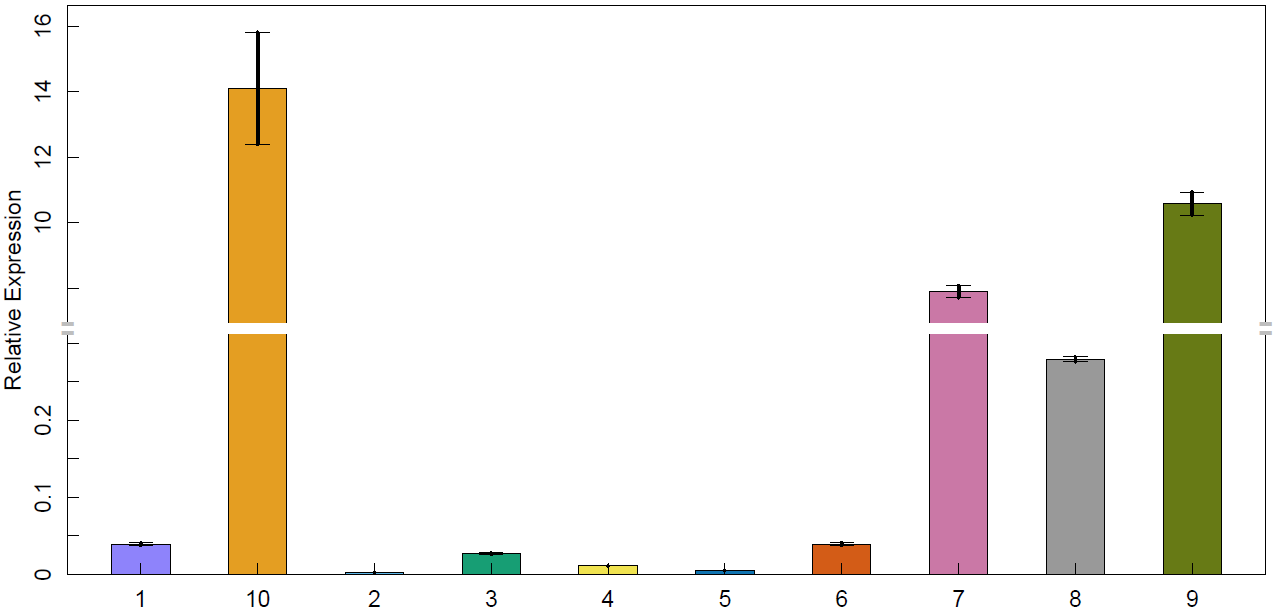
4. 截断bar图
5. 差异基因火山图
6. 拟时序热图