Error bars are a graphical representation of the variability of data and are used on graphs to indicate the error, or uncertainty in a reported measurement. They give a general idea of how precise a measurement is, or conversely, how far from the reported value the true (error free) value might be. Error bars often represent one standard deviation of uncertainty, one standard error, or a certain confidence interval (e.g., a 95% interval).
Add error bar used R
loading data1
plot(mpg~disp,data=mtcars)
verticality error bars
1 | arrows(x0=mtcars$disp, |
结果如下: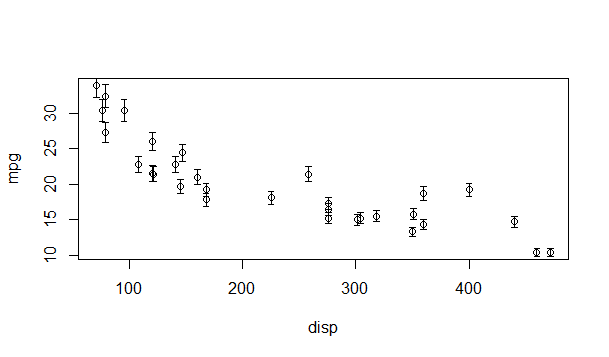
horizontal error bars
1 | arrows(x0=mtcars$disp*0.95, |
结果如下: