R当中的坐标中断一般都使用plotrix库中的axis.break(), gap.plot(), gap.barplot(), gap.boxplot()等几个函数来实现.
axis.break
1 | library(plotrix) |
parameters
1 | axis.break(axis=1,breakpos=NULL,pos=NA,bgcol="white",breakcol="black", |
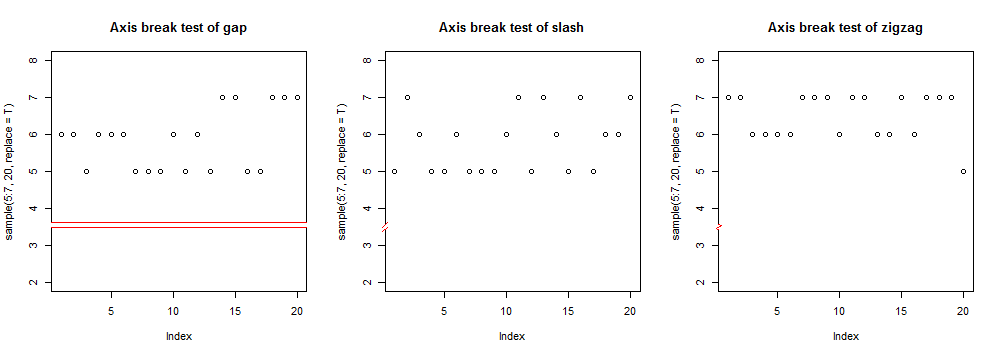
gap.plot
1 | opar<-par(mfrow=c(1,3)) |
1
2
3
4
5
6
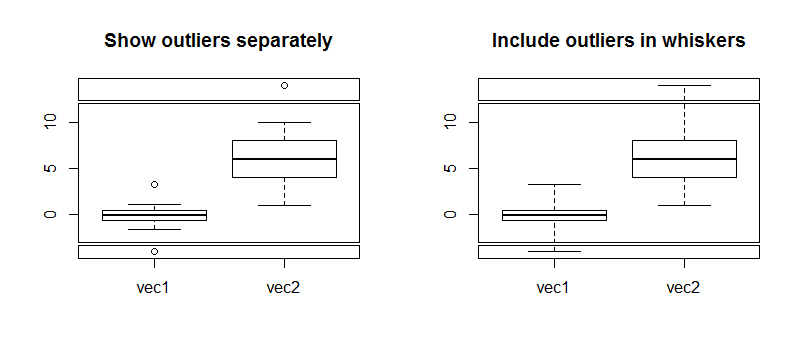
7opar<-par(mfrow=c(1,2))
twovec<-list(vec1=c(rnorm(30),-6),vec2=c(sample(1:10,40,TRUE),20))
gap.boxplot(twovec,gap=list(top=c(12,18),bottom=c(-5,-3)),
main="Show outliers separately")
gap.boxplot(twovec,gap=list(top=c(12,18),bottom=c(-5,-3)),range=0,
main="Include outliers in whiskers")
par(opar)
1
2
3
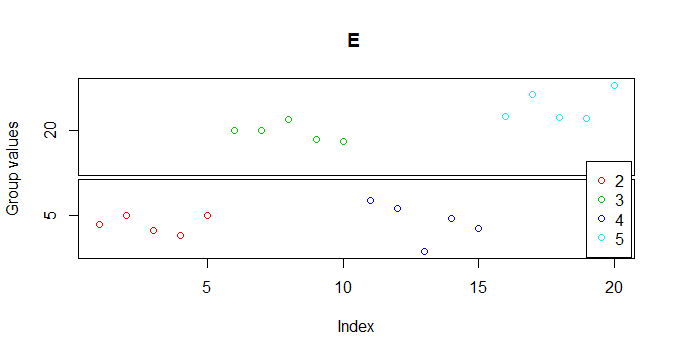
4twogrp<-c(rnorm(5)+4,rnorm(5)+20,rnorm(5)+5,rnorm(5)+22)
gpcol<-c(2,2,2,2,2,3,3,3,3,3,4,4,4,4,4,5,5,5,5,5)
gap.plot(twogrp,gap=c(8,16),xlab="Index",ylab="Group values", main="E ",col=gpcol)
legend(19, 9.5, c("2","3","4","5"), pch = 1, col = 2:5)
parameters
1 | gap.plot(x,y,gap,gap.axis="y",bgcol="white",breakcol="black",brw=0.02,xlim=range(x),ylim=range(y), |
gap.barplot
使用gap.plot, gap.barplot, gap.boxplot之后重新使用axis.break来修改中断类型,使得看上去美一点,
并绘制出双反斜线中断,可以视实际情况延伸断点起止位置.1
2
3
4
5
6
7
8
9
10
11
12
13
14
15
16
17
18
19
20
21
22
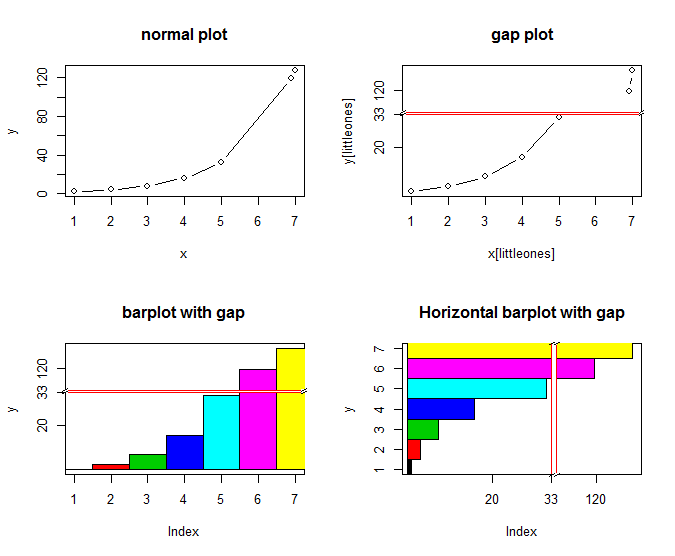
23library(plotrix)
opar<-par(mfrow=c(2,2))
x<-c(1:5,6.9,7)
y<-2^x
from<-33
to<-110
plot(x,y,type="b",main="normal plot")
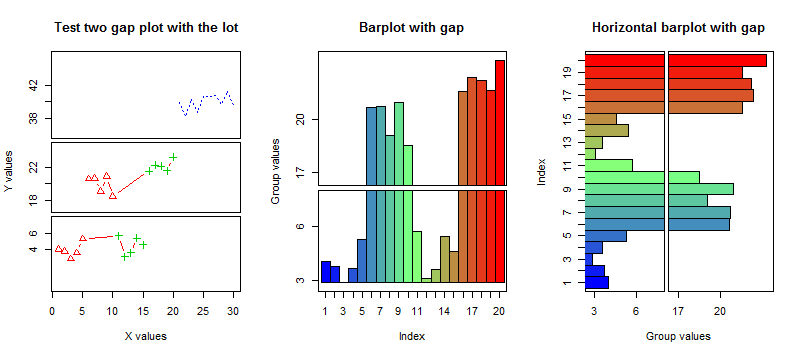
gap.plot(x,y,gap=c(from,to),type="b",main="gap plot")
axis.break(2,from,breakcol="red",style="gap")
axis.break(2,from*(1+0.02),breakcol="black",style="slash")
axis.break(4,from*(1+0.02),breakcol="black",style="slash")
axis(2,at=from)
gap.barplot(y,gap=c(from,to),col=as.numeric(x),main="barplot with gap")
axis.break(2,from,breakcol="red",style="gap")
axis.break(2,from*(1+0.02),breakcol="black",style="slash")
axis.break(4,from*(1+0.02),breakcol="black",style="slash")
axis(2,at=from)
gap.barplot(y,gap=c(from,to),col=as.numeric(x),horiz=T,main="Horizontal barplot with gap")
axis.break(1,from,breakcol="red",style="gap")
axis.break(1,from*(1+0.02),breakcol="black",style="slash")
axis.break(3,from*(1+0.02),breakcol="black",style="slash")
axis(1,at=from)
par(opar)
如果画图过程中困惑了,记得重新来看一下内容,有惊喜:1
2
3
4
5
6
7
8
9
10
11
12
13
14
15
16
17
18
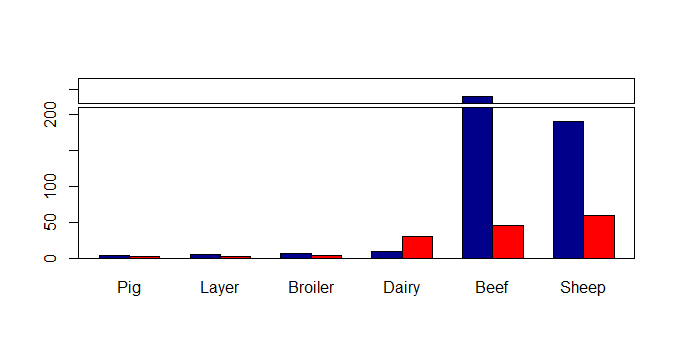
19x1=c(3,5,6,9,375,190);
x1
x2=c(2,2,3,30,46,60);
x2
data=rbind(x1,x2);
data
colnames(data)=c("Pig","Layer","Broiler","Dairy","Beef","Sheep")
rownames(data)=c("1980","2010")
data
library(plotrix)
newdata<-data
newdata[newdata>200]<-newdata[newdata>200]-150
newdata
barpos<-barplot(newdata,names.arg=colnames(newdata),
ylim=c(0,250),beside=TRUE,col=c("darkblue","red"),axes=FALSE)
axis(2,at=c(0,50,100,150,200,235),
labels=c(0,50,100,150,200,375))
box()
axis.break(2,210,style="gap")
Contribution from :http://www.dataguru.cn/article-4827-1.html