修改坐标的函数
修改坐标的这类属性,要用到theme()函数:1
2gg<-ggplot(diamonds[1:20,])
gg+geom_bar(aes(price,fill=cut)) + theme(axis.text.x=element_text(family="myFont2",face="bold",size=10,angle=45,color="red"))
效果:
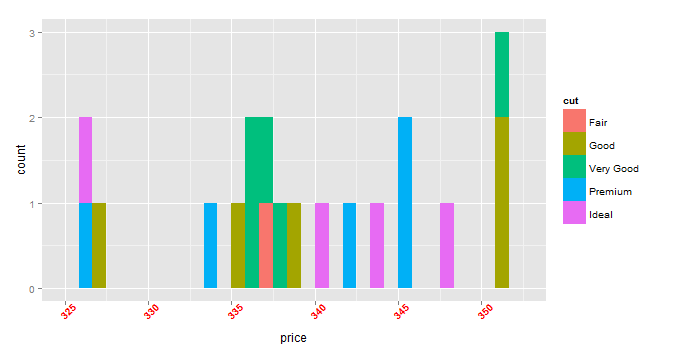
解释:
凡事要修改坐标文字的格式,都加一句来修改:1
theme(axis.text.x=theme_text(X轴属性),asix.text.y=theme_text(Y轴属性))
theme_text()是存储文字属性的函数,其内置属性如下:1
2
3
4
5family:字体
face:粗体、斜体等
size:字体大小
angle:倾斜角度
color:颜色
修改字体
提前设置一下字体:1
windowsFonts(myFont1=windowsFont("Times New Roman"),myFont2=windowsFont("宋体"))
然后才可以用family来修改字体1
Family="myfont1"
修改字体粗细
Face可以设置的属性有以下几个:1
2
3
4plain:普通
italic:斜体
bold:粗体
bold.italic:粗体+斜体
修改尺寸大小
用数字代表字体大小即可,普通的字体可以设置为1
size=8
修改角度
1 | angle=45 |
表示字体逆时针倾斜45°,范围是0-360
修改颜色
用color或者colour都可以修改颜色,颜色用关键字来表示,或者用十六进制的颜色代码来表示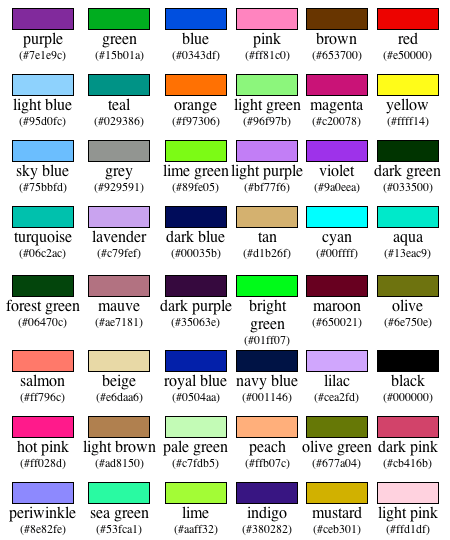
详细说明http://blog.csdn.net/bone_ace/article/details/47362619
http://www.cookbook-r.com/Graphs/Colors_(ggplot2)/
修改位置
修改位置用下面的参数:1
2
3hjust:调整横向位置
vjust:调整纵向位置
上面都设置数字,一般调整0.5左右,可以是负值
修改刻度标签
1 | xname<-c("a","b") |
scale_xx_manual(values=c(a,b,c))对ggplot2自动设置aes()进行修改,xx可以是aes()包括的fill,colour,shape.
legend图例的修改
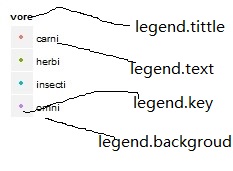
ggplot2中的legend包括四个部分:legend.tittle, legend.text, legend.key, legend.backgroud。针对每一部分有四种处理方式:
element_text()绘制标签和标题,可控制字体的family, face, colour, size, hjust, vjust, angle, lineheight,当改变角度时,序将hjust调整至0或1.
element_rect()绘制主要供背景使用的矩形,你可以控制颜色的填充(fill)和边界的colour, size, linetype
element_blank()表示空主题,即对元素不分配相应的绘图空间。该函数可以山区我们不感兴趣的绘图元素。使用之前的colour=NA,fill=NA,让某些元素不可见,但仍然占绘图空间。
element_get()可得到当前主题的设置。
theme()可在一幅图中对某些元素进行局部性修改,theme_update()可为后面图形的绘制进行全局性的修改
不加Legend1
p+theme(legend.title=element_blank())
图例(legend)的位置1
p+theme(legend.position="left")
图例(legend)的位置和对齐使用的主题设置legend.position来控制,其值可为right,left,top,bottom,none。
修改legend.tittle内容1
2
3
4p+scale_colour_hue(name="what does it eat?",breaks=c("herbi","carni","omni",NA),labels=c("plants","meat","both","don't know"))
注:name定义标签标题(legend.tittle)
breaks为标签原内容(legend.text)
labels为自定义后的标签内容(legend.text)
修改尺寸大小1
2
3
4p+theme(legend.background=element_rect(colour="purple",fill="pink",size=3,linetype="dashed"));
p+theme(legend.key.size=unit(2,'cm'));
p+theme(legend.key.width=unit(5,'cm'));
p+theme(legend.text = element_text(colour = 'red', angle = 45, size = 10, hjust = 3, vjust = 3, face = 'bold'))
报错:could not find function “unit”
解决办法:library(grid)
颜色的修改以及一致性1
2
3
4library(RColorBrewer);
newpalette<-colorRampPalette(brewer.pal(12,"Set3"))(length(unique(eee$name)));
p+scale_fill_manual(values=newpalette);
p+geom_bar(position="stack",aes(order=desc(name)))
更多图例修改:https://github.com/hadley/ggplot2/wiki/Legend-Attributes
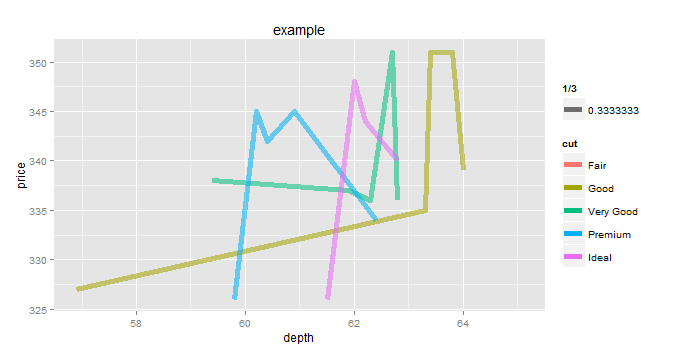
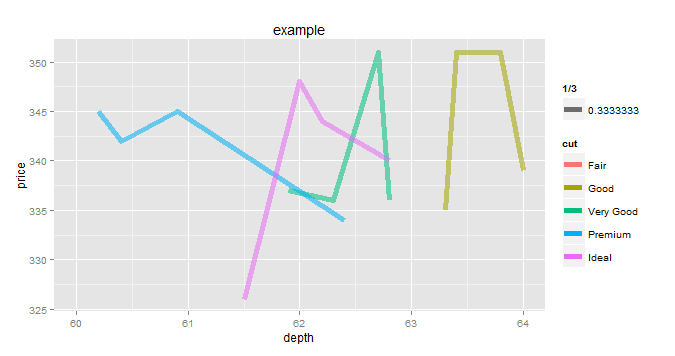
修改坐标轴的显示范围
1 | gg+geom_line(aes(depth,price,color=cut,alpha=1/3),size=2) +labs(title="example") |
1
2
3gg+geom_line(aes(depth,price,color=cut,alpha=1/3),size=2) +
labs(title="example") +
scale_x_continuous(limits=c(60,64))
修改坐标的显示刻度
1 | gg+geom_line(aes(depth,price,color=cut,alpha=1/3),size=2) + |

修改坐标轴显示间隔用到breaks参数,并且要用seq(起始值,终止值,间隔)函数来设置间隔1
2
3
4gg+geom_line(aes(depth,price,color=cut,alpha=1/3),size=2) +
labs(title="example") +
scale_x_continuous(limits=c(60,64),breaks=seq(60,64,2)) +
theme(axis.text.x=element_text(angle=45,size=5))

Contribution from :http://blog.sina.com.cn/s/blog_670445240102v250.html