If the p-value is < .05, then the probability of falsely rejecting the null hypothesis is <5%, right? That means, a maximum of 5% of all significant results is a false-positive (that’s what we control with the α rate).
Well, no. As you will see in a minute, the “false discovery rate” (aka. false-positive rate), which indicates the probability that a significant p-value actually is a false-positive, usually is much higher than 5%.
A common misconception about p-values
Oates (1986) asked the following question to students and senior scientists:1
2
3You have a p-value of .01. Is the following statement true, or false?
You know, if you decide to reject the null hypothesis, the probability that you are making the wrong decision.
The answer is “false” (you will learn why it’s false below). But 86% of all professors and lecturers in the sample who were teaching statistics (!) answered this question erroneously with “true”. Gigerenzer, Kraus, and Vitouch replicated this result in 2000 in a German sample (here, the “statistics lecturer” category had 73% wrong). Hence, it is a wide-spread error to confuse the p-value with the false discovery rate.
The False Discovery Rate (FDR) and the Positive Predictive Value (PPV)
To answer the question “What’s the probability that a significant p-value indicates a true effect?”, we have to look at the positive predictive value (PPV) of a significant p-value. The PPV indicates the proportion of significant p-values which indicate a real effect amongst all significant p-values. Put in other words: Given that a p-value is significant: What is the probability (in a frequentist sense) that it stems from a real effect?
(The false discovery rate simply is 1-PPV: the probability that a significant p-value stems from a population with null effect).
That is, we are interested in a conditional probability Prob(effect is real | p-value is significant).
Inspired by Colquhoun (2014) one can visualize this conditional probability in the form of a tree-diagram (see below). Let’s assume, we carry out 1000 experiments for 1000 different research questions. We now have to make a couple of prior assumptions (which you can make differently in the app we provide below). For now, we assume that 30% of all studies have a real effect and the statistical test used has a power of 35% with an α level set to 5%. That is of the 1000 experiments, 300 investigate a real effect, and 700 a null effect. Of the 300 true effects, 0.35300 = 105 are detected, the remaining 195 effects are non-significant false-negatives. On the other branch of 700 null effects, 0.05700 = 35 p-values are significant by chance (false positives) and 665 are non-significant (true negatives).
This path is visualized here (completely inspired by Colquhoun, 2014):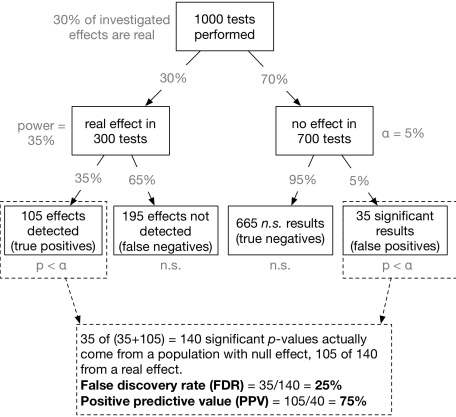
Now we can compute the false discovery rate (FDR): 35 of (35+105) = 140 significant p-values actually come from a null effect. That means, 35/140 = 25% of all significant p-values do not indicate a real effect! That is much more than the alleged 5% level.
Contribution from :http://www.r-bloggers.com/whats-the-probability-that-a-significant-p-value-indicates-a-true-effect/