RNA-seq 分析是我当年入门生信的敲门砖,有参/无参的分析,当然还有现在升级的基于PacBio全长转录组的Illumina RNA-seq分析;
测序样本的重复性很重要,但总是能接到一些无重复的样本,对于他们的分析就没有像三次重复那么的顺手和多选择;
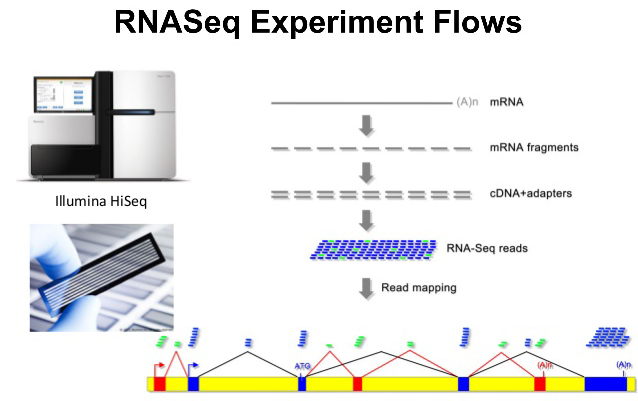
零、输入数据
输入数据通常为count结果,很多工具可以用于生成此counts table 文件,
- [x] 如基于基因组比对的htseq-count;
- [x] 基于全基因组的转录组结果的
- Salmon (Patro et al. 2017)
- Sailfish (Patro, Mount, and Kingsford 2014)
- kallisto (Bray et al. 2016)
- RSEM (Li and Dewey 2011)
上述软件通常第一步即对全转录组建立索引文件👇
获取转录组
For this example, we’ll be analyzing some Arabidopsis thaliana data, so we’ll download and index the A. thaliana transcriptome.1
curl ftp://ftp.ensemblgenomes.org/pub/plants/release-28/fasta/arabidopsis_thaliana/cdna/Arabidopsis_thaliana.TAIR10.28.cdna.all.fa.gz -o athal.fa.gz
建立索引
1 | salmon index -t athal.fa.gz -i athal_index |
定量基因表达情况
1 |
|
后续差异基因分析
Once you have your quantification results you can use them for downstream analysis with differential expression tools like DESeq2, edgeR, limma, or sleuth. Using the tximport package, you can import salmon’s transcript-level quantifications and optionally aggregate them to the gene level for gene-level differential expression analysis. You can read more about how to import salmon’s results into DESeq2 by reading the tximport section of the excellent DESeq2 vignette. For instructions on importing for use with edgeR or limma, see the tximport vignette. For preparing salmon output for use with sleuth, see the wasabi package.
==首选 DESeq 的方法;==
一、Analysing no replicate RNA-seq data with LPEseq package
LPEseq was designed for the RNA-Seq data with a small number of replicates, especially with non-replicate in each class. Also LPEseq can be equally applied both count-base and FPKM-based (non-count values) input data.
二、IsoEM2
三、edgeR
The quasi-likelihood method is highly recommended for differential expression analyses of bulk RNA-seq data as it gives stricter error rate control by accounting for the uncertainty in dispersion estimation. The likelihood ratio test can be useful in some special cases such as single cell RNA-seq and datasets with no replicates.
四、NOISeq: Differential Expression in RNA-seq
1 | library(NOISeq) |
If NOISeq-sim has been used because no replicates are available, then it is preferable to use a higher threshold such as q = 0.9
五、DESeq2
Can I use DESeq2 to analyze a dataset without replicates? 和 Question: Deseq2 for RNAseq experiments without replicates
For an experiment without replicates, you should just run DESeq() as normal.
1 | library(DESeq2) |
或者利用 tximport直接将多个kallisto结果文件abundance.tsv导入R中;
tximport 导入数据1
2
3
4
5
6
7library("tximport")
samples <- read.table("/public/home/zpxu/hulisong/scripts/count_sleuth_info.txt", header = TRUE)
dir <- "/public/home/zpxu/hulisong/results/kallisto"
files <- file.path(dir, samples$sample, "abundance.tsv")
names(files) <- samples$sample
txi.kallisto.tsv <- tximport(files, type = "kallisto", txOut=TRUE)
head(txi.kallisto.tsv$counts)
DESeq2 进行差异表达计算1
2
3
4
5
6
7
8
9
10
11
12
13
14
15
16
17
18
19
20
21
22
23
24
25
26
27
28library("DESeq2")
head(txi.kallisto.tsv$counts)
raw_count <- txi.kallisto.tsv$counts
countdata1 <- round(raw_count)
head(countdata1)
## 去掉整行是0的行
all <- apply(countdata1, 1, function(x) all(x==0) )
newdata <- countdata1[!all,]
head (newdata)
## 筛选行总和大于200的行
dat <- newdata[rowSums(newdata > 200) >= 1,]
countdata <- as.matrix(dat)
head(countdata)
countData <- countdata[,c("controlH_1", "treatH1_1")]
myfactors <- read.table("/public/home/zpxu/hulisong/scripts/count_sleuth_info.txt",header=T)
myfactors
## 根据需要比较的样本筛选出相应的行
colData <- myfactors[c(1,3),]
dds <- DESeqDataSetFromMatrix(
countData = countData,
colData = colData,
design = ~ condition)
colData(dds)$condition <- factor(colData(dds)$condition,levels=c("H0","H1"))
dds
dds <- DESeq(dds)
res <- results(dds)
res <- res[order(res$padj),]
head(res)
六、DESeq
1 | library( "DESeq" ) |
输出结果中 foldChange 和 log2FoldChange 列包含有 Inf 和 -Inf,根据 Re-extracting refgene names after DESeq Analysis
解释,是因为同一个基因在样本A中count极端大,而在样本 B 中为零造成的;那么如何避免这种问题出现呢?根据 Question: Statistical question (Deseq, Cuffdis) when one condition is zero? 解释,通常做法是全部数据都加一个较小的数值,但这也一个较小的数值也会在 log2FoldChange 时被放大;
A popular strategy to cope with zeros is to add a small number to all counts so that you avoid division by zero and at the same time you don’t bias the results (e.g. 1000:0 is reasonably equivalent to 1001:1). Having said that, this is an issue that bugs me sometime when interpreting fold change ratios since small numbers can have a large effect which is not consistent with the biological interpretation. For example, if you add 1 to all your counts you could get log2(1001/1)= 9.97; if instead you add 0.1(biologically the same, I would argue) you get log2(1000.1/0.1)= 13.29, which is a big difference.
结果中存在 NA 的解释见 Question: Deseq Infinite In Logfc And Na For P Value 和 DESeq: “NA” generated in the resulted differentially expressed genes,不影响结果,直接去掉即可👇1
2mydf[complete.cases(mydf), ]
resSig<-na.omit(resSig)
其他参考教程:RNA-Seq: differential expression using DESeq
多个组合比较差异基因分析
如下 Cross_DF.R 脚本可对不同组合进行差异基因的分析;
使用方式为:Rscript Cross_DF.R controlH_1 treatH1_1 /public/home/zpxu/hulisong/results/123/ 0.05
其中,
- 第一个参数(controlH_1)为比较的对照;
- 第二个参数(treatH1_1)为另外一组样本,即进行
controlH_1和treatH1_1之间的比较来找出差异基因; - 第三个参数(/public/home/zpxu/hulisong/results/123/) 为结果输出路径,包括保存的csv和pdf图片;
- 第四个参数(0.05) 为最后差异基因筛选时
padj的阈值和画MA图片时的padj值;1
2
3
4
5
6
7
8
9
10
11
12
13
14
15
16
17
18
19
20
21
22
23
24
25
26
27
28
29
30
31
32
33
34
35
36
37
38
39
40
41
42
43
44
45
46
47
48
49
50
51
52
53
54
55
56
57
58
59
60
61
62
63
64
65
66
67
68
69
70
71
72arg <- commandArgs(T)
###### Input kallisto results ##########
print("Input kallisto results")
library("tximport")
myfactors <- read.table("/public/home/zpxu/hulisong/scripts/count_sleuth_info.txt", header = TRUE)
dir <- "/public/home/zpxu/hulisong/results/cds_kallisto"
files <- file.path(dir, myfactors$sample, "abundance.tsv")
names(files) <- myfactors$sample
txi.kallisto.tsv <- tximport(files, type = "kallisto", txOut=TRUE)
head(txi.kallisto.tsv$counts)
############## For DEGs ################
library( "DESeq" )
raw_count <- txi.kallisto.tsv$counts
#raw_count <- read.csv("/public/home/zpxu/hulisong/results/kallisto/All.counts.csv", header=TRUE, row.names=1)
head(raw_count)
#myfactors <- read.table("/public/home/zpxu/hulisong/scripts/count_sleuth_info.txt",header=T)
countdata1 <- round(raw_count)
head(countdata1)
all <- apply(countdata1, 1, function(x) all(x==0) )
newdata <- countdata1[!all,]
head (newdata)
countdata <- as.matrix(newdata)
head(countdata)
condition = myfactors$sample
cds = newCountDataSet( countdata, condition )
# Normalisation
print("Normalisation All Data")
cds = estimateSizeFactors(cds)
sizeFactors( cds )
head( counts( cds, normalized=TRUE ) )
# Select sample and do Variance estimation
print("Select sample and do Variance estimation")
cds2 = cds[ ,c(arg[1], arg[2]) ]
cds2 = estimateDispersions( cds2, method="blind", sharingMode="fit-only",fitType = "local" )
outdir <- arg[3]
pdf(file=paste0(outdir,arg[1],"_Vs_",arg[2],".pdf"))
print("Plot the per-gene estimates against the mean normalized counts per gene and overlay the fitted curve")
plotDispEsts(cds2)
#### Calling differential expression ###########
print("Calling differential expression")
res = nbinomTest( cds2, arg[1], arg[2] )
plotMA(res,col = ifelse(res$padj>=arg[4], "gray32", "red3"), main=paste0(arg[1],"_Vs_",arg[2]))
hist(res$pval, breaks=100, col="skyblue", border="slateblue", main=paste0(arg[1],"_Vs_",arg[2]))
resSig = res[ res$padj < arg[4], ]
N_resSig <- resSig[complete.cases(resSig), ]
write.csv( N_resSig, paste0(outdir,arg[1],"_Vs_",arg[2],".csv"),row.names = FALSE)
############### The follows is option and can not do it If your want #####
############### Variance stabilizing transformation ##########
print("Variance stabilizing transformation")
vsd = varianceStabilizingTransformation( cds2 )
library("vsn")
notAllZero = (rowSums(counts(cds))>0)
meanSdPlot(log2(counts(cds)[notAllZero, ] + 1))
meanSdPlot(vsd[notAllZero, ])
########### Data quality assessment by sample clustering and visualisation ####
print("Data quality assessment by sample clustering and visualisation")
print("Heatmap of the count table")
vsdFull = varianceStabilizingTransformation( cds2 )
library("RColorBrewer")
library("gplots")
select = order(rowMeans(counts(cds2)), decreasing=TRUE)[1:30]
hmcol = colorRampPalette(brewer.pal(9, "GnBu"))(100)
heatmap.2(exprs(vsdFull)[select,], col = hmcol, trace="none", margin=c(10, 6))
print("Heatmap of the sample-to-sample distances")
dists = dist( t( exprs(vsdFull) ) )
mat = as.matrix( dists )
rownames(mat) = colnames(mat) = with(pData(cds2), paste(condition, condition, sep=" : "))
heatmap.2(mat, trace="none", col = rev(hmcol), margin=c(13, 13))
print("Principal component plot of the samples")
print(plotPCA(vsdFull, intgroup=c("condition", "condition")))
dev.off()
print(paste0("Run Complete. Please Check The Results in Directory: ",outdir))
批量不同组合运行方式👇1
2
3
4for i in treatR1_1 treatR2_1 treatR3_1 treatR4_1 treatR5_1
do
Rscript Cross_DF.R controlR_1 ${i} /public/home/zpxu/hulisong/results/123/ 0.05
done
七、LPEseq
1 | install.packages("devtools") |
八、GFOLD
基于基因组比对的bam文件计算差异表达基因;
Example 1: Count reads and rank genes
In the following example, hg19Ref.gtf is the ucsc knownGene table in GTF format for hg19; sample1.sam and sample2.sam are the mapped reads in SAM format.1
2
3gfold count -ann hg19Ref.gtf -tag sample1.sam -o sample1.read_cnt
gfold count -ann hg19Ref.gtf -tag sample2.sam -o sample2.read_cnt
gfold diff -s1 sample1 -s2 sample2 -suf .read_cnt -o sample1VSsample2.diff
Example 2: Count reads
This example utilizes samtools to produce mapped reads in SAM format from BAM format.1
samtools view sample1.bam | gfold count -ann hg19Ref.gtf -tag stdin -o sample1.read_cnt
Example 3: Identify differentially expressed genes without replicates
Suppose there are two samples: sample1 and sample2 with corresponding read count file being sample1.read_cnt sample2.read_cnt. This example finds differentially expressed genes using default parameters on two samples1
gfold diff -s1 sample1 -s2 sample2 -suf .read_cnt -o sample1VSsample2.diff
Example 4: Identify differentially expressed genes with replicates
This example finds differentially expressed genes using default parameters on two group of samples.1
gfold diff -s1 sample1,sample2,sample3 -s2 sample4,sample5,sample6 -suf .read_cnt -o 123VS456.diff
Example 5: Identify differentially expressed genes with replicates only in one condition
This example finds differentially expressed genes using default parameters on two group of samples. Only the first group contains replicates. In this case, the variance estimated based on the first group will be used as the variance of the second group.1
gfold diff -s1 sample1,sample2 -s2 sample3 -suf .read_cnt -o 12VS3.diff