单因子方差分析
方差分析(analysis of variance, 简写为ANOVA)是工农业生产和科学研究中分析试验数据的一种有效的统计方法. 引起观测值不同(波动)的原因主要有两类: 一类是试验过程中随机因素的干扰或观测误差所引起不可控制的的波动, 另一类则是由于试验中处理方式不同或试验条件不同引起的可以控制的波动.
方差分析的主要工作就是将观测数据的总变异(波动)按照变异的原因的不同分解为因子效应与试验误差,并对其作出数量分析,发现多组数据之间的差异显著行,比较各种原因在总变异中所占的重要程度,以此作为进一步统计推断的依据.
在进行方差分析之前先对几条假设进行检验,由于随机抽取,假设总体满足独立、正态,考察方差齐次性(用bartlett检验).
正态性检验
在进行方差分析前先对输入数据做正态性检验。
对数据的正态性,利用Shapiro-Wilk正态检验方法(W检验),它通常用于样本容量n≤50时,检验样本是否符合正态分布。
R中,函数shapiro.test()提供了W统计量和相应P值,所以可以直接使用P值作为判断标准(P值大于0.05说明数据正态),其调用格式为shapiro.test(x),参数x即所要检验的数据集,它是长度在3到5000之间的向量。1
2
3
4
5
6
7
8
9
10nx <- c(rnorm(10))
nx
[1] -0.83241783 -0.29609562 -0.06736888 -0.02366562
0.23652392 0.97570959
[7] -0.85301145 1.51769488 -0.84866517 0.20691119
shapiro.test(nx)
Shapiro-Wilk normality test
data: nx
W = 0.9084, p-value = 0.2699
#检验结果,因为p 值小于W 值,所以数据为正态分布.
更多正态性检验见:R语言做正态分布检验
其中,D检验(Kolmogorov - Smirnov)是比较精确的正态检验法。
方差齐性检验
方差分析的另一个假设:方差齐性,需要检验不同水平下的数据方差是否相等。R中最常用的是Bartlett检验,bartlett.test()调用格式为1
bartlett.test(x,g…)
其中,参数X是数据向量或列表(list) ; g是因子向量,如果X是列表则忽略g.当使用数据集时,也通过formula调用函数:1
bartlett.test(formala, data, subset,na.action…)
formula是形如lhs一rhs的方差分析公式;data指明数据集:subset是可选项,可以用来指定观测值的一个子集用于分析:na.action表示遇到缺失值时应当采取的行为。1
2
3
4
5
6
7
8> x=c(x1,x2,x3)
> account=data.frame(x,A=factor(rep(1:3,each=7)))
> bartlett.test(x~A,data=account)
Bartlett test of homogeneity of variances
data: x by A
Bartlett's K-squared = 0.13625, df = 2, p-value = 0.9341
由于P值远远大于显著性水平a=0.05,因此不能拒绝原假设,我们认为不同水平下的数据是等方差的。
方差分析:F-Test
In R the function var.test allows for the comparison of two variances using an F-test.Although it is possible to compare values of s2 for two samples, there is no capability within R for comparing the variance of a sample,s2,to the variance of a population, σ2. The syntax for the testing variances is :1
var.test(X, Y, ratio = 1, alternative = "two.sided", conf.level = 0.95)
where X and Y are vectors containing the two samples.
The optional command ratio is the null hypothesis; the default value is 1 if not specified.
The command alternative gives the alternative hypothesis should the experimental F-ratio is found to be significantly different than that specified by ratio. The default for alternative is “two-sided” with the other possible choices being “less” or “greater” .
The command conf.level gives the confidence level to be used in the test and the default value of 0.95 is equivalent to α = 0.05.
Here is a typical result using the objects std.method and new.method.1
2
3
4
5
6
7
8
9
10
11
12
13
14
15
16
17> std.method<-c( 21.62, 22.20, 24.27, 23.54, 24.25, 23.09, 21.01 )
> new.method<-c(21.54 ,20.51 ,22.31, 21.30, 24.62, 25.72, 21.54 )
> var(std.method); var(new.method)
[1] 1.638495
[1] 3.690329
> var.test(std.method, new.method)
F test to compare two variances
data: std.method and new.method
F = 0.444, num df = 6, denom df = 6, p-value = 0.3462
alternative hypothesis: true ratio of variances is not equal to 1
95 percent confidence interval:
0.07629135 2.58395513
sample estimates:
ratio of variances
0.4439971
There are two ways to interpret the results provided by R.
First, the p-value provides the smallest value of α for which the F-ratio is significantly different from the hypothesized value.
If this value is larger than the desired α, then there is insufficient evidence to reject the null hypothesis; otherwise, the null hypothesis is rejected. Second, R provides the desired confidence interval for the F-ratio;
if the calculated value falls within the confidence interval, then the null hypothesis is retained. For this example, the null hypothesis is retained and we find no evidence for a difference in the variances for the objects std.method and new.method. Note that R does not restrict the F-ratio to values greater than 1.
1)判断组间是否有差别
R中的函数aov()用于方差分析的计算,其调用格式为:1
aov(formula, data = NULL, projections =FALSE, qr = TRUE,contrasts = NULL, ...)
其中的参数formula表示方差分析的公式,在单因素方差分析中即为x~A ;
data表示做方差分析的数据框:projections为逻辑值,表示是否返回预测结果;
qr同样是逻辑值,表示是否返回QR分解结果,默认为TRUE;
contrasts是公式中的一些因子的对比列表;
通过函数summary()可列出方差分析表的详细结果。
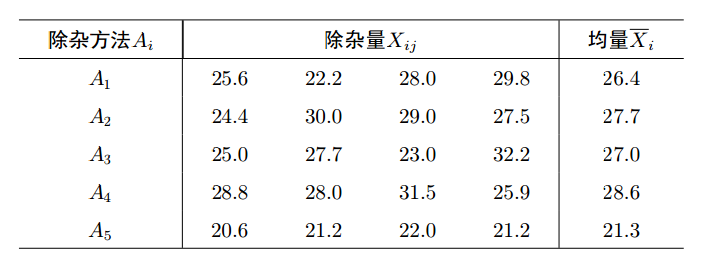
以淀粉为原料生产葡萄的过程中, 残留许多糖蜜, 可作为生产酱色的原料. 在生产酱色的过程之前应尽可能彻彻底底除杂, 以保证酱色质量.为此对除杂方法进行选择. 在实验中选用5种不同的除杂方法, 每种方法做4次试验, 即重复4次, 结果见表.
1
2
3
4
5
6
7
8
9
10
11
12
13
14
15
16
17
18
19
20
21
22
23
24
25
26
27
28
29
30
31
32
33> X<-c(25.6, 22.2, 28.0, 29.8, 24.4, 30.0, 29.0, 27.5, 25.0, 27.7,
23.0, 32.2, 28.8, 28.0, 31.5, 25.9, 20.6, 21.2, 22.0, 21.2)
> A<-factor(rep(1:5, each=4))
> miscellany<-data.frame(X, A)
> miscellany
X A
1 25.6 1
2 22.2 1
3 28.0 1
4 29.8 1
5 24.4 2
6 30.0 2
7 29.0 2
8 27.5 2
9 25.0 3
10 27.7 3
11 23.0 3
12 32.2 3
13 28.8 4
14 28.0 4
15 31.5 4
16 25.9 4
17 20.6 5
18 21.2 5
19 22.0 5
20 21.2 5
> aov.mis<-aov(X~A, data=miscellany)
> summary(aov.mis)
Df Sum Sq Mean Sq F value Pr(>F)
A 4 132.0 32.99 4.306 0.0162 *
Residuals 15 114.9 7.66
---
Signif. codes: 0 '***' 0.001 '**' 0.01 '*' 0.05 '.' 0.1 ' ' 1
代码解释
上述结果中, Df表示自由度; sum Sq表示平方和; Mean Sq表示均方和;
F value表示F检验统计量的值, 即F比; Pr(>F)表示检验的p值; A就是因素A;
Residuals为残差.
可以看出, F = 4.3061 > F0.05(5-1, 20-5) = 3.06, 或者p=0.01618<0.05,
说明有理由拒绝原假设, 即认为五种除杂方法有显著差异.
2)如果有差别,判断是哪两组间有差别
其中,上述所得结果为5个除杂方法之间的差异显著性分析,如果假设上述5中处理中A1为对照组,其余A2,A3,A4,A5均为处理组,现在若想分析一个对照和多个处理间的差异显著性,可以通过以下代码实现:
1 | > A1A2<-miscellany[1:8,] |
即选取对照为一组数据,处理为另一组,缺点是对于多个处理一个对照需要重复此操作,现在还没找到好的处理办法,希望以后能学到或者有谁知道望相告。
最近总结出的另一个比较有效的办法:
接上aov()的F检验通过summary(aov.mis)看出五种除杂方法有显著差异.接下来考察具体的差异(多重比较)通过 TukeyHSD()函数:
1
2
3
4
5
6
7
8
9
10
11
12
13
14
15
16
17
18
19
20
21
22
23
24
25
26
27
28
29
30
31
32
33
34
35
36
37
38
39
40
41
42 > TukeyHSD(aov.mis)
Tukey multiple comparisons of means
95% family-wise confidence level
Fit: aov(formula = X ~ A, data = miscellany)
$A
diff lwr upr p adj
2-1 1.325 -4.718582 7.3685818 0.9584566
3-1 0.575 -5.468582 6.6185818 0.9981815
4-1 2.150 -3.893582 8.1935818 0.8046644
5-1 -5.150 -11.193582 0.8935818 0.1140537
3-2 -0.750 -6.793582 5.2935818 0.9949181
4-2 0.825 -5.218582 6.8685818 0.9926905
5-2 -6.475 -12.518582 -0.4314182 0.0330240
4-3 1.575 -4.468582 7.6185818 0.9251337
5-3 -5.725 -11.768582 0.3185818 0.0675152
5-4 -7.300 -13.343582 -1.2564182 0.0146983
> miscellany
X A
1 25.6 1
2 22.2 1
3 28.0 1
4 29.8 1
5 24.4 2
6 30.0 2
7 29.0 2
8 27.5 2
9 25.0 3
10 27.7 3
11 23.0 3
12 32.2 3
13 28.8 4
14 28.0 4
15 31.5 4
16 25.9 4
17 20.6 5
18 21.2 5
19 22.0 5
20 21.2 5
#TukeyHSD图
> plot(TukeyHSD(aov.mis))
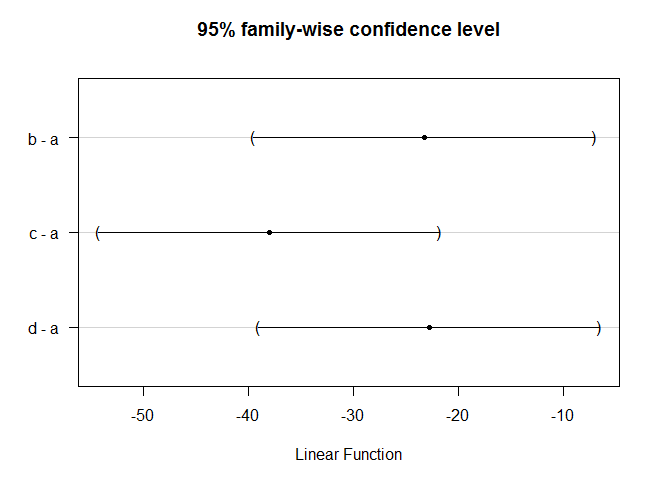
注意:可以看出上述结果是所有分组间的两两比较,但经常我们所需要的仅仅是一个对照组和其他几个处理组间的比较,这时multcomp包是不错的选择;
Dunnett1
2
3
4
5
6
7
8
9
10
11
12
13
14
15
16a = c(56,60,44,53)
b = c(29,38,18,35)
c = c(11,25,7,18)
d = c(26,44,20,32)
strains.frame = data.frame(a, b, c, d)
strains = stack(strains.frame) #stack是reshape2包中的一个函数,用于将宽格式数据转化为长格式;
colnames(strains) = c("weight", "group")
##常规的两两相互比较计算
TukeyHSD( aov(weight ~ group, data=strains) )
library(multcomp)
summary(glht(aov(weight ~ group, data=strains), linfct=mcp(group="Dunnett")))
## The first group ("a" in this example) is used as the reference group.
## If this is not the case, use the relevel() command to set the reference.
strains$group = relevel(strains$group, "b")
summary(glht(aov(weight ~ group, data=strains), linfct=mcp(group="Dunnett")))
plot(glht(aov(weight ~ group, data=strains), linfct=mcp(group="Dunnett")))

More: http://barcwiki.wi.mit.edu/wiki/SOPs/anova
multcomp包部分参数解释:
glht:General Linear Hypotheses,General linear hypotheses and multiple comparisons for parametric models, including generalized linear models, linear mixed effects models, and survival models.
linfct:a specification of the linear hypotheses to be tested,即指定之前的线性model将用于何种检验。
mcp (Multiple comparisons):多重比较的意思,For each factor, which is included in model as independent variable, a contrast matrix or a symbolic description of the contrasts can be specified as arguments to mcp,其参数意思为Tukey’s all-pair comparisons or Dunnett’s comparison with a control.
同样高效的办法:
1
2
3
4
5
6
7
8
9
10
11
12
13
14
15
16
17
18
19
20
21
22
23
24
25
26
27
28
29
30
31
32
33
34
35
36
37> person <- rep(c(1:10),2)
> treat <- c("A","B","A","A","B","B","A","B","A","B","B","A","B","B","A","A","B","A","B","A")
> phase <- rep(c(1,2),each=10)
> x <- c(760,860,568,780,960,940,635,440,528,800,770,855,602,800,958,952,650,450,530,803)
> data46 <- data.frame(person,treat,phase,x)
> data46$person<-factor(data46$person)
> data46
person treat phase x
1 1 A 1 760
2 2 B 1 860
3 3 A 1 568
4 4 A 1 780
5 5 B 1 960
6 6 B 1 940
7 7 A 1 635
8 8 B 1 440
9 9 A 1 528
10 10 B 1 800
11 1 B 2 770
12 2 A 2 855
13 3 B 2 602
14 4 B 2 800
15 5 A 2 958
16 6 A 2 952
17 7 B 2 650
18 8 A 2 450
19 9 B 2 530
20 10 A 2 803
> result<-aov(x~phase+person+treat,data=data46)
> summary(result)
Df Sum Sq Mean Sq F value Pr(>F)
phase 1 490 490 9.925 0.0136 *
person 9 551111 61235 1240.195 1.32e-11 ***
treat 1 198 198 4.019 0.0799 .
Residuals 8 395 49
---
Signif. codes: 0 ?**?0.001 ?*?0.01 ??0.05 ??0.1 ??1
观察p adj值发现两两二者间的方差显著性.
据上述结果可以填写下面的方差分析表:
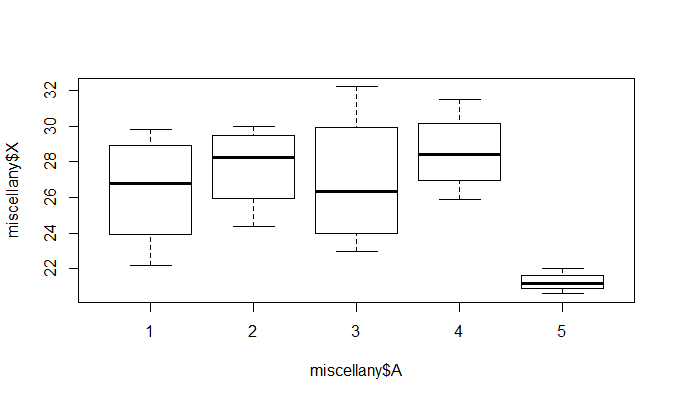
再通过函数plot( )绘图可直观描述5种不同除杂方法之间的差异, R中运行命令1
> plot(miscellany$X~miscellany$A)

从图形上也可以看出, 5种除杂方法产生的除杂量有显著差异, 特别第5种与前面的4种, 而方法1与3, 方法2与4的差异不
明显.
Contribution from :http://www.cnblogs.com/jpld/p/4594003.html
