hope

A new day is coming,whether we like it or not. The question is will you control it,or will it control you?


  • Home

  • Archives

  • Code

  • Categories

  • Tags

  • Footprint

  • qRT-PCR

  • Project

  • Publish

  • SCI Figure

  • About

  • CV

  • Search

Linux常用命令之sort强悍参数“k”

Posted on 2015-11-29 | In Linux | Comments: | Views: ℃
| Words count in article: | Reading time ≈

准备素材

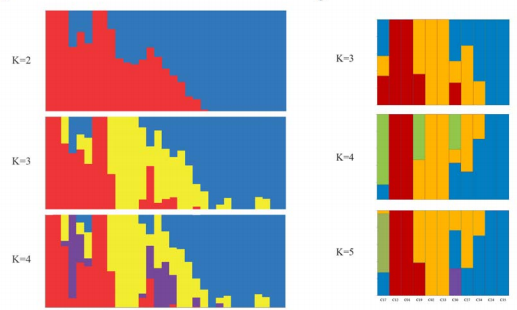
1
2
3
4
5
$ cat facebook.txt
google 110 5000
baidu 100 5000
guge 50 3000
sohu 100 4500

第一个域是公司名称,第二个域是公司人数,第三个域是员工平均工资。

排序

让这个文件按公司的字母顺序排序,也就是按第一个域进行排序:(这个facebook.txt文件有三个域)

1
2
3
4
5
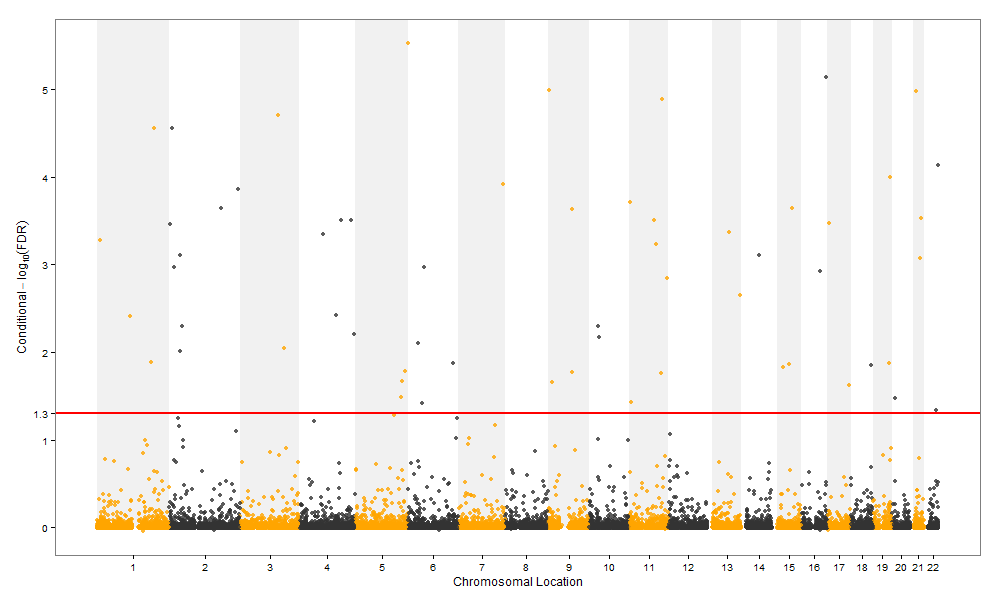
$ sort -t ' ' -k 1 facebook.txt
baidu 100 5000
google 110 5000
guge 50 3000
sohu 100 4500

看到了吧,就直接用-k 1设定就可以了。(其实此处并不严格,稍后你就会知道)
若数据存在表头,而我们一般不需要对表头排序,但是又希望排序后表头依然存在,该如何操作呢?

1
2
## if you have two header lines and want to keep both of them:
(sed -n '1,2p' your_file; cat your_file | sed '1,2d' | sort) > sort_header.txt

让facebook.txt按照公司人数排序

1
2
3
4
5
$ sort -n -t ' ' -k 2 facebook.txt
guge 50 3000
baidu 100 5000
sohu 100 4500
google 110 5000

但是,此处出现了问题,那就是baidu和sohu的公司人数相同,都是100人,这个时候怎么办呢?按照默认规矩,是从第一个域开始进行升序排序,因此baidu排在了sohu前面。
让facebook.txt按照公司人数排序 ,人数相同的按照员工平均工资升序排序:

1
2
3
4
5
$ sort -n -t ' ' -k 2 -k 3 facebook.txt
guge 50 3000
sohu 100 4500
baidu 100 5000
google 110 5000

加了一个-k2 -k3就解决了问题,sort支持这种设定,就是说设定域排序的优先级,先以第2个域进行排序,如果相同,再以第3个域进行排序。(如果你愿意,可以一直这么写下去,设定很多个排序优先级)
让facebook.txt按照员工工资降序排序,如果员工人数相同的,则按照公司人数升序排序:

1
2
3
4
5
$ sort -n -t ' ' -k 3r -k 2 facebook.txt
baidu 100 5000
google 110 5000
sohu 100 4500
guge 50 3000

此处有使用了一些小技巧,你仔细看看,在-k 3后面偷偷加上了一个小写字母r,r和-r选项的作用是一样的,就是表示逆序。因为sort默认是按照升序排序的,所以此处需要加上r表示第三个域(员工平均工资)是按照降序排序。此处你还可以加上n,就表示对这个域进行排序时,要按照数值大小进行排序,举个例子吧:

1
2
3
4
5
$ sort -t ' ' -k 3nr -k 2n facebook.txt
baidu 100 5000
google 110 5000
sohu 100 4500
guge 50 3000

看,我们去掉了最前面的-n选项,而是将它加入到了每一个-k选项中了。

-k选项的具体语法格式

要继续往下深入的话,就不得不来点理论知识。你需要了解-k选项的语法格式,如下:

1
[ FStart [ .CStart ] ] [ Modifier ] [ , [ FEnd [ .CEnd ] ][ Modifier ] ]

这个语法格式可以被其中的逗号(”,”)分为两大部分,Start部分和End部分。

先给你灌输一个思想,那就是”如果不设定End部分,那么就认为End被设定为行尾”。这个概念很重要的,但往往你不会重视它。

Start部分也由三部分组成,其中的Modifier部分就是我们之前说过的类似n和r的选项部分。我们重点说说Start部分的FStart和C.Start。

C.Start也是可以省略的,省略的话就表示从本域的开头部分开始。之前例子中的-k 2和-k 3就是省略了C.Start的例子喽。

FStart.CStart,其中FStart就是表示使用的域,而CStart则表示在FStart域中从第几个字符开始算”排序首字符”。

同理,在End部分中,你可以设定FEnd.CEnd,如果你省略.CEnd,则表示结尾到”域尾”,即本域的最后一个字符。或者,如果你将CEnd设定为0(零),也是表示结尾到”域尾”。

从公司英文名称的第二个字母开始进行排序:

1
2
3
4
5
$ sort -t ' ' -k 1.2 facebook.txt
baidu 100 5000
sohu 100 4500
google 110 5000
guge 50 3000

使用了-k 1.2,这就表示对第一个域的第二个字符开始到本域的最后一个字符为止的字符串进行排序。你会发现baidu因为第二个字母是a而名列榜首。sohu和google第二个字符都是o,但sohu的h在google的o前面,所以两者分别排在第二和第三。guge只能屈居第四了。

只针对公司英文名称的第二个字母进行排序,如果相同的按照员工工资进行降序排序:

1
2
3
4
5
$ sort -t ' ' -k 1.2,1.2 -k 3,3nr facebook.txt
baidu 100 5000
google 110 5000
sohu 100 4500
guge 50 3000

由于只对第二个字母进行排序,所以我们使用了-k 1.2,1.2的表示方式,表示我们”只”对第二个字母进行排序。(如果你问”我使用-k 1.2怎么不行?”,当然不行,因为你省略了End部分,这就意味着你将对从第二个字母起到本域最后一个字符为止的字符串进行排序)。对于员工工资进行排序,我们也使用了-k 3,3,这是最准确的表述,表示我们”只”对本域进行排序,因为如果你省略了后面的3,就变成了我们”对第3个域开始到最后一个域位置的内容进行排序”了。

在modifier部分还可以用到哪些选项?

可以用到b、d、f、i、n 或 r。

其中n和r你肯定已经很熟悉了。

b表示忽略本域的签到空白符号。

d表示对本域按照字典顺序排序(即,只考虑空白和字母)。

f表示对本域忽略大小写进行排序。

i表示忽略”不可打印字符”,只针对可打印字符进行排序。(有些ASCII就是不可打印字符,比如\a是报警,\b是退格,\n是换行,\r是回车等等)

思考关于-k和-u联合使用的例子:

1
2
3
4
5
$ cat facebook.txt
google 110 5000
baidu 100 5000
guge 50 3000
sohu 100 4500

这是最原始的facebook.txt文件。

1
2
3
4
5
6
7
8
9
$ sort -n -k 2 facebook.txt
guge 50 3000
baidu 100 5000
sohu 100 4500
google 110 5000
$ sort -n -k 2 -u facebook.txt
guge 50 3000
baidu 100 5000
google 110 5000

当设定以公司员工域进行数值排序,然后加-u后,sohu一行就被删除了!原来-u只识别用-k设定的域,发现相同,就将后续相同的行都删除。

1
2
3
4
5
6
7
8
9
10
$ sort  -k 1 -u facebook.txt
baidu 100 5000
google 110 5000
guge 50 3000
sohu 100 4500

$ sort -k 1.1,1.1 -u facebook.txt
baidu 100 5000
google 110 5000
sohu 100 4500

这个例子也同理,开头字符是g的guge就没有幸免于难。

1
2
3
4
5
$ sort -n -k 2 -k 3 -u facebook.txt
guge 50 3000
sohu 100 4500
baidu 100 5000
google 110 5000

咦!这里设置了两层排序优先级的情况下,使用-u就没有删除任何行。原来-u是会权衡所有-k选项,将都相同的才会删除,只要其中有一级不同都不会轻易删除的:)(不信,你可以自己加一行sina 100 4500试试看)

最诡异的排序:

1
2
3
4
5
$ sort -n -k 2.2,3.1 facebook.txt
guge 50 3000
baidu 100 5000
sohu 100 4500
google 110 5000

以第二个域的第二个字符开始到第三个域的第一个字符结束的部分进行排序。

第一行,会提取0 3,第二行提取00 5,第三行提取00 4,第四行提取10 5。

又因为sort认为0小于00小于000小于0000….

因此0 3肯定是在第一个。10 5肯定是在最后一个。但为什么00 5却在00 4前面呢?(你可以自己做实验思考一下。)

答案揭晓:原来”跨域的设定是个假象”,sort只会比较第二个域的第二个字符到第二个域的最后一个字符的部分,而不会把第三个域的开头字符纳入比较范围。当发现00和00相同时,sort就会自动比较第一个域去了。当然baidu在sohu前面了。用一个范例即可证实:

1
2
3
4
5
$ sort -n -k 2.2,3.1 -k 1,1r facebook.txt
guge 50 3000
sohu 100 4500
baidu 100 5000
google 110 5000

有时候在sort命令后会看到+1 -2这些符号,这是什么东东?

关于这种语法,最新的sort是这么进行解释的:

On older systems, sort' supports an obsolete origin-zero syntax+POS1 [-POS2]’ for specifying sort keys. POSIX 1003.1-2001 (*note Standards conformance::) does not allow this; use `-k’ instead.

原来,这种古老的表示方式已经被淘汰了,以后可以理直气壮的鄙视使用这种表示方法的脚本喽!

(为了防止古老脚本的存在,在这再说一下这种表示方法,加号表示Start部分,减号表示End部分。最最重要的一点是,这种方式方法是从0开始计数的,以前所说的第一个域,在此被表示为第0个域。以前的第2个字符,在此表示为第1个字符.)

其他有用参数

V(大写):聪明的字母和数字排序

1
2
3
4
5
6
7
8
9
10
11
12
13
14
15
16
17
18
19
20
21
22
23
24
25
26
27
cat example2.bed
chr2 15 19
chr22 32 46
chr10 31 47
chr1 34 49
chr11 6 16
chr2 17 22
chr2 27 46
chr10 30 42
$ sort -k1,1 -k2,2n example2.bed
chr1 34 49
chr10 30 42
chr10 31 47
chr11 6 16
chr2 15 19
chr2 17 22
chr2 27 46
chr22 32 46
$ sort -k1,1V -k2,2n example2.bed
chr1 34 49
chr2 15 19
chr2 17 22
chr2 27 46
chr10 30 42
chr10 31 47
chr11 6 16
chr22 32 46

V is only for GNU sort which will sort chromsome in alpha-numeric order。

设置临时目录

1
2
-T, --temporary-directory=DIR
use DIR for temporaries, not $TMPDIR or /tmp; multiple options specify multiple directories

因为sort命令默认临时文件目录为”/tmp”,在sort执行过程中,如果产生的临时文件过大会导致”/tmp”目录被占满的。


Contribution from :
本原创文章属于《Linux大棚》博客,博客地址为http://roclinux.cn。文章作者为rocrocket。

sed:流编辑器(stream editor)简单总结

Posted on 2015-11-29 | In Linux | Comments: | Views: ℃
| Words count in article: | Reading time ≈

Sed简介

sed 是一种在线编辑器,它一次处理一行内容。处理时,把当前处理的行存储在临时缓冲区中,称为”模式空间”(pattern space),接着用sed命令处理缓冲区中的内容,处理完成后,把缓冲区的内容送往屏幕。接着处理下一行,这样不断重复,直到文件末尾。文件内容并没有 改变,除非你使用重定向存储输出。

sed命令形式

1
2
sed [options] 'command' file(s)    
sed [options] -f scriptfile file(s)

sed command

command部分可以分为两部分,一部分是确定范围部分,一部分是处理方式部分。

确定范围部分

1 指定行数:例如3,5表示第3、第4和第5行;5,$表示第5行至最后一行;
2 用模式匹配进行指定:例如/^[^dD]/表示匹配行首不是以d或D开头的行等;

处理方式部分呢,有很多命令可用,介绍几个最常用的:

d 表示删除行
p 打印该行
r 读取指定文件的内容
w 写入指定文件sed ‘/200[4-6]/w new.txt’ mysed.txt(w new.txt表示将来源于mysed.txt中含有2004、2005、2006的行写入到new.txt文件中)
a\ 在特定行”下面”插入特定内容sed ‘/2004/a\China’ mysed.txt
i\ 在特定行”上面”插入特定内容sed ‘/2004/i\China’ mysed.txt
y 就表示将第一栏的每个字符都替换为相对应的第二栏的字符sed ‘y/eijng/EIJNG/‘ mysed.txt
n; 对匹配行的下一行进行处理sed ‘/2004/{n;y/eijng/EIJNG/;}’ mysed.txt (找含有2004的行,然后将它下面的一行中的eijng替换为大写的EIJNG。这里面的”n;”起到了”移至下一行”的作用。n背后的含义其实是将下一行放到模式空间中去)

sed选项

1
2
3
4
5
6
-e command, --expression=command  允许多台编辑,sed -n -e '1,2p' -e '4p' mysed.txt 
-h, --help 打印帮助,并显示bug列表的地址。
-n, --quiet, --silent 取消默认输出(默认为全输出),-n之后只输出后面处理过的行。
-f, --filer=script-file 引导sed脚本文件名。
-V, --version 打印版本和版权信息。
-r, --regexp-extended 使用扩展的正则表达式,如果不用r参数就要在正则表达式里使用很多的\来进行强制转换,如果使用r了就可以直接写正则表达式,而不用写那么多\了

sed元字符集

1
2
3
4
5
6
7
8
9
10
11
12
13
^  锚定行的开始 如:/^sed/匹配所有以sed开头的行。  
$ 锚定行的结束 如:/sed$/匹配所有以sed结尾的行。
. 匹配一个非换行符的字符 如:/s.d/匹配s后接一个任意字符,然后是d。
* 匹配零或多个字符 如:/*sed/匹配所有模板是一个或多个空格后紧跟sed的行。
[] 匹配一个指定范围内的字符,如/[Ss]ed/匹配sed和Sed。
[^]匹配一个不在指定范围内的字符,如:/[^A-RT-Z]ed/匹配不包含A-R和T-Z的一个字母开头,紧跟ed的行。
\(..\) 保存匹配的字符,如s/\(love\)able/\1rs,loveable被替换成lovers。
& 保存搜索字符用来替换其他字符,如s/love/**&**/,love变成**love**。
\< 锚定单词的开始,如:/\<love/匹配包含以love开头的单词的行。
\> 锚定单词的结束,如/love\>/匹配包含以love结尾的单词的行。
x\{m\} 重复字符x,m次,如:/0\{5\}/匹配包含5个o的行。
x\{m,\} 重复字符x,至少m次,如:/o\{5,\}/匹配至少有5个o的行。
x\{m,n\} 重复字符x,至少m次,不多于n次,如:/o\{5,10\}/匹配5--10个o的行。

sed实例

例一 显示test文件的第20到30行:sed -n ‘20,30p’ test
例二 将所有以d或D开头的行的所有小写x变为大写X:sed ‘/^[dD]/s/x/X/g’ test
例三 删除每行最后的两个字符:sed ‘s/..$//‘ test
例四 删除每一行的前两个字符:sed ‘s/..//‘ test
例五

1
2
3
4
5
$cat mysed.txt
Beijing Beijing Beijing Beijing
$sed 's/\(Beijing\)\(.*\)\(Beijing\)/\12008\2\32008/' mysed.txt
Beijing2008 Beijing Beijing Beijing2008
##这个命令稍显复杂,其中用到了一个技巧,就是预存储,即被\(和\)括起来的匹配内容会被按顺序存储起来,存储到\1、\2…里面。这样你就可以使用\加数字来调用这些内容了。这个例子就是使用了这个技巧,分别存储了三个内容,分别为匹配Beijing、匹配.*和匹配Beijing。

任意字符: sed -n ‘/.ing/‘p temp.txt 注意是.ing,而不是ing
‘s/^[][]
//g’ 删除行首空格
‘s/^$/d’ 删除空行
‘s/COL/(…/)//g’ 删除紧跟COL的后三个字母

morehttp://www.grymoire.com/Unix/Sed.html
Contribution from :
http://roclinux.cn/?p=1363
http://www.iteye.com/topic/587673
http://www.cnblogs.com/emanlee/archive/2013/09/07/3307642.html

python模块安装--无root权限(easy_install和pip)

Posted on 2015-11-27 | In Python | Comments: | Views: ℃
| Words count in article: | Reading time ≈

easy_install是由PEAK(Python Enterprise Application Kit)开发的setuptools包里带的一个命令,所以使用easy_install实际上是在调用setuptools来完成安装模块的工作。 Perl 用户比较熟悉 CPAN,而 Ruby 用户则比较熟悉 Gems;引导 setuptools 的ez_setup工具和随之而生的扩展后的easy_install 与”Cheeseshop”(Python Package Index,也称为 “PyPI”)一起工作来实现相同的功能。它可以很方便的让您自动下载,编译,安装和管理Python包。【百度百科】
easy_install和pip都是用来下载安装Python一个公共资源库PyPI的相关资源包的,pip类似RedHat里面的yum,安装Python包非常方便。本节详细介绍pip的安装、以及使用方法。

首先安装setuptools

1
2
3
4
wget "https://bitbucket.org/pypa/setuptools/get/default.tar.gz#egg=setuptools-dev" --no-check-certificate
tar -xzvf default.tar.gz
cd pypa-setuptools-eb92fc5071bf //依据你的解压目录名而定
python setup.py install

安装easy_install

1
wget https://pypi.python.org/pypi/ez_setup

解压,安装.

1
python ez_setup.py

easy_install安装包

1
easy_install 【要安装的模块】

pip下载安装

1
wget "https://pypi.python.org/packages/source/p/pip/pip-1.5.4.tar.gz#md5=834b2904f92d46aaa333267fb1c922bb" --no-check-certificate

pip安装

1
2
3
tar -xzvf pip-1.5.4.tar.gz
cd pip-1.5.4
python setup.py install

pip使用详解

pip安装包

1
2
3
pip install SomePackage
[...]
Successfully installed SomePackage

pip查看已安装的包

1
2
3
4
5
6
7
pip show --files SomePackage
Name: SomePackage
Version: 1.0
Location: /my/env/lib/pythonx.x/site-packages
Files:
../somepackage/__init__.py
[...]

pip检查哪些包需要更新

1
2
pip list --outdated
SomePackage (Current: 1.0 Latest: 2.0)

pip升级包

1
2
3
4
5
6
7
pip install --upgrade SomePackage
[...]
Found existing installation: SomePackage 1.0
Uninstalling SomePackage:
Successfully uninstalled SomePackage
Running setup.py install for SomePackage
Successfully installed SomePackage

pip卸载包

1
2
3
4
5
pip uninstall SomePackage
Uninstalling SomePackage:
/my/env/lib/pythonx.x/site-packages/somepackage
Proceed (y/n)? y
Successfully uninstalled SomePackage

常见错误

1
ImportError No module named setuptools

解决办法:安装setuptools

Genes and Isoforms

Posted on 2015-11-25 | In Bioinformatics | Comments: | Views: ℃
| Words count in article: | Reading time ≈

Isoforms

Definition(s)

Different forms of a protein that may be produced from different genes, or from the same gene by alternative splicing.
Definition from: MeSH via Unified Medical Language System at the National Library of Medicine
The protein products of different versions of messenger RNA created from the
same gene by employing different promoters, which causes transcription to
skip certain exons. Since the promoters are tissue-specific, different tissues
express different protein products of the same gene.
Definition from: GeneReviewsfrom the University of Washington and the National Center for Biotechnology Information

Related discussion in the Handbook

  • Are fingerprints determined by genetics?
  • Gene

    Definition(s)

    The functional and physical unit of heredity passed from parent to offspring. Genes are pieces of DNA, and most genes contain the information for making a specific protein.
    Definition from: Physician Data Query via Unified Medical Language System at the National Library of Medicine
    The basic unit of heredity, consisting of a segment of DNA arranged in a linear
    manner along a chromosome, which codes for a specific protein or segment
    of protein leading to a particular characteristic or function.
    Definition from: GeneReviewsfrom the University of Washington and the National Center for Biotechnology.
    The gene is the basic physical unit of inheritance. Genes are passed from parents to offspring and contain the information needed to specify traits. Genes are arranged, one after another, on structures called chromosomes. A chromosome contains a single, long DNA molecule, only a portion of which corresponds to a single gene. Humans have approximately 23,000 genes arranged on their chromosomes.
    Definition from: Talking Glossary of Genetic Terms from the National Human Genome Research Institute
    The fundamental physical and functional unit of heredity. A gene is an ordered sequence of nucleotides located in a particular position on a particular chromosome that encodes a specific functional product (i.e., a protein or RNA molecule).
    Definition from: Human Genome Project Informationat the U.S. Department of Energy

    Related discussion in the Handbook

  • What is a gene?
  • How do geneticists indicate the location of a gene?
  • Gene Therapy
  • What are gene families?
  • See also Understanding Medical Terminology.

    重测序文献精读

    Posted on 2015-11-14 | In Bioinformatics | Comments: | Views: ℃
    | Words count in article: | Reading time ≈

    了解一项新的工作或研究内容,文献精读是首选,而Nature系类文章技术含金量高,文章内容条理清晰,精读一定会收获颇丰。
    全基因组重测序是对已知基因组序列的物种进行不同个体的基因组测序,并在此基础上对个体或群体进行差异性分析。全基因组重测序的个体,通过序列比对,可以找到大量的单核苷酸多态性位点(SNP),插入缺失位点(InDel,Insertion/Deletion)、结构变异位点(SV,Structure Variation)位点,在全基因组水平上扫描并检测与重要性状相关的基因序列差异和结构变异,实现遗传进化分析及重要性状候选基因预测。
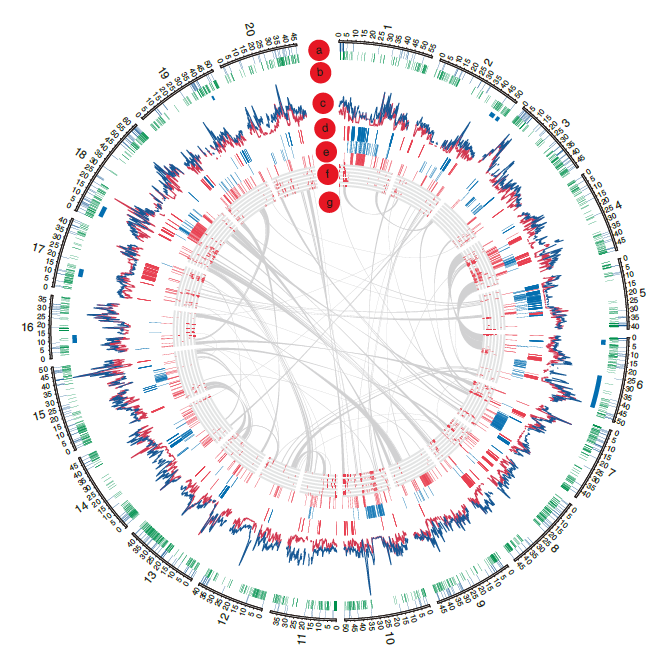
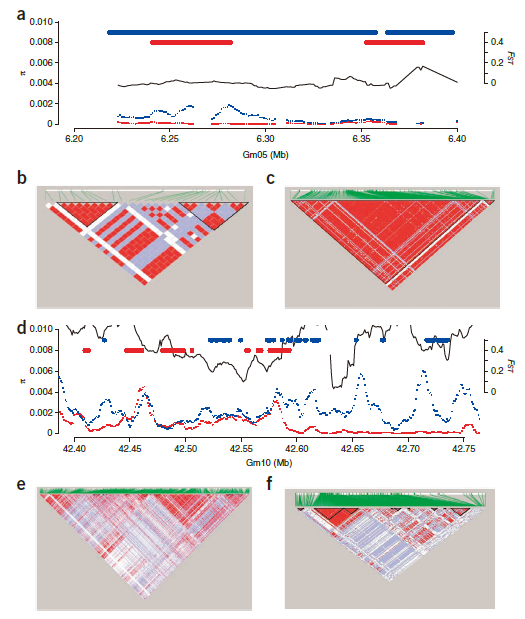
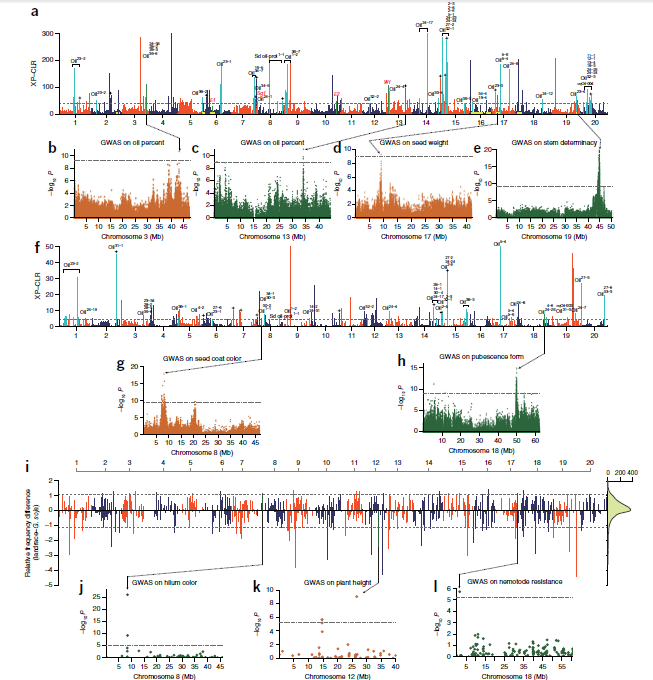
    基于其研究的重要性,Google Scholar关键词搜索resequence,检索到《Resequencing of 31 wild and cultivated soybean genomes identifies patterns of genetic diversity and selection》,《Resequencing 302 wild and cultivated accessions identifies genes related to domestication and improvement in soybean》,现选择第一篇精读。

    关键点总结

    测序相关

    1. Approximately ×5 depth and >90% coverage.
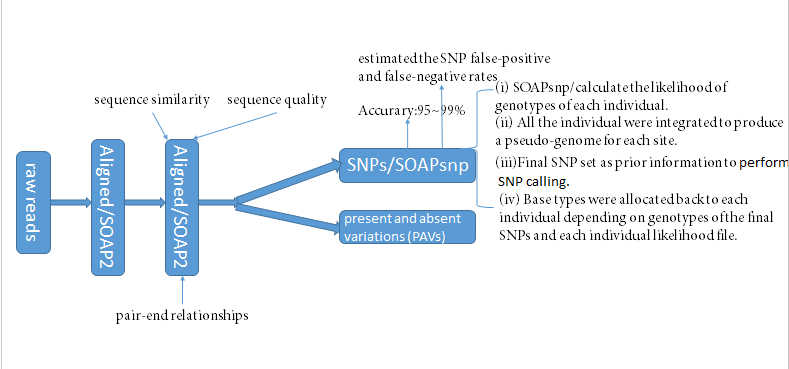
    2. Previous reports have shown that the SNP calling accuracy from resequencing data is ~95–99% (Wang, J. et al. The diploid genome sequence of an Asian individual. Nature 456,60–65 (2008);Xia, Q. et al. Complete resequencing of 40 genomes reveals domestication events and genes in silkworm (Bombyx). Science 326, 433–436 (2009)).
    3. D-value (Tajima’s D) distribution was significantly higher that indicating a significant loss of rare SNPs, which may be due to reduced recombination within the LD blocks.
    4. Divergence index (FST) value allowed us to identify genomic regions of large FST value, which signified areas having a high degree of diversification.Subregions that have very high FST values may provide an indication of the functional genes or alleles involved.
    5. A genome-wide sequencing comparison to reveal haplotype sharing could provide a unique tool to identify introgression events in the history of these cultivars.
    6. Previous studies have indicated that whole genome duplication (WGD) events can cause gene loss and rapid functional diversification.

      大豆研究相关

    7. They have exceptionally high linkage disequilibrium (LD) and a high ratio of average nonsynonymous versus synonymous nucleotide differences (Nonsyn/Syn).
    8. There was a recent history of introgression from wild soybean.
    9. Human selection probably had a strong impact on the genetic diversity in the cultivated soybeans.
    10. Genome-wide analyses showed the opposite: we found that the low-frequency alleles were less abundant among the wild as compared to the cultivated accessions.
    11. In comparison with other crops, SNP analysis showed that the cultivated soybean exhibited a lower diversity (cultivated soybean: 1.89 × 10⁻³; rice: 2.29 × 10⁻³; corn: 6.6 × 10⁻³).
    12. The average distance over which LD decays to half of its maximum value in soybean was substantially longer than that of all plants analyzed
      to date.
    13. SNP analyses in the LD blocks showed that there was a lower SNP ratio in long LD blocks as compared to the whole genome in both wild and cultivated.
    14. Allelic diversity in wild soybeans was higher than in cultivated soybeans across the entire genome.
    15. Only ~3% of the total SNPs identified were present in coding regions. The remaining ~97% SNPs were in noncoding regions.
    16. The presence of a higher Nonsyn/Syn value at the whole-genome level and more large-effect mutations suggested that the soybean genome had accumulated a higher ratio of deleterious mutations.
    17. High LD(long LD blocks) would result in the lack of effective recombination; consequently, deleterious mutations could not be eliminated and would accumulate.
    18. Selection signals during domestication and improvement.

      分析大致流程

    19. 进化相关工作,包括phylogenetic tree(iTO),principle component analysis(PCA),population structure(Bayesian clustering analysis).
    20. Whole-genome SNP analysis (using the parameter θπ) and the distribution of genome-wide diversity.
    21. High linkage disequilibrium and genomewide patterns of nucleotide diversity(Selection and introgression).
    22. Genome duplication(copy number variations (CNVs)) and Gene content variation.

      涉及软件

    23. STRUCTURE,Bayesian clustering program,http://pritchardlab.stanford.edu/structure.html
    24. Haploview,LD analysis,https://www.broadinstitute.org/scientific-community/science/programs/medical-and-population-genetics/haploview/haploview
    25. AUGUSTUS ,基因注释,http://bioinf.uni-greifswald.de/augustus/
    26. GeneWise and Genomewise,http://www.ncbi.nlm.nih.gov/pmc/articles/PMC479130/ ,http://www.ebi.ac.uk/Tools/psa/genewise/
      GeneWise, which predicts gene structure using similar protein sequences, and Genomewise, which provides a gene structure final parse across cDNA- and EST-defined spliced structure. Both algorithms are heavily used by the Ensembl annotation system. The GeneWise algorithm was developed from a principled combination of hidden Markov models (HMMs). Both algorithms are highly accurate and can provide both accurate and complete gene structures when used with the correct evidence.
    27. SOAP and SOAPsnp,Short Oligonucleotide Alignment Program(45-bp or 76-bp), http://soap.genomics.org.cn/;
    28. BWA,Paired-end sequencing reads mapping,http://sourceforge.net/projects/bio-bwa/files/
    29. SAMtools,SNP detectionhttp://www.htslib.org/,http://biobits.org/samtools_primer.html
    30. Picard package,Duplicated reads filtered,http://picard.sourceforge.net/
    31. BEDtools,coverage of sequence alignmentshttp://bedtools.readthedocs.org/en/latest/
    32. Genome Analysis Toolkit (GATK),SNP/Indel calling,https://www.broadinstitute.org/gatk/gatkdocs/org_broadinstitute_gatk_tools_walkers_genotyper_UnifiedGenotyper.php
    33. ANNOVAR,SNP annotationhttp://annovar.openbioinformatics.org/en/latest/
    34. EIGENSOFT,Principal component analysis (PCA) of whole-genome SNPshttp://genetics.med.harvard.edu/reich/Reich_Lab/Software.html
    35. PLINK,Whole genome association analysis toolset,http://pngu.mgh.harvard.edu/~purcell/plink/
    36. GAPIT,Genome Association and Predictionhttp://www.maizegenetics.net/#!gapit/cmkv
    37. manhattan plot,https://pods.iplantcollaborative.org/wiki/display/eot/Make+manhattan+plot+with+ggplot2+script,http://blog.how-to-code.info/r/Manhattan-plot.html

      内容补充链接

    38. Tajima’s D,https://en.wikipedia.org/wiki/Tajima%27s_D;http://baike.baidu.com/link?url=hkRPQcUtBVMTVhMl2wzKGLy5QtDcrMwonUV7CspqxqdphkGztrSNFZLiUYazq6oz6rxZyVoy1YhHjexhi9Op9_.
    39. Penn State University Center for Comparative Genomics and Bioinformatics,http://www.bx.psu.edu/miller_lab/

    What's the probability that a significant p-value indicates a true effect?

    Posted on 2015-11-14 | In Bioinformatics | Comments: | Views: ℃
    | Words count in article: | Reading time ≈

    If the p-value is < .05, then the probability of falsely rejecting the null hypothesis is <5%, right? That means, a maximum of 5% of all significant results is a false-positive (that’s what we control with the α rate).

    Well, no. As you will see in a minute, the “false discovery rate” (aka. false-positive rate), which indicates the probability that a significant p-value actually is a false-positive, usually is much higher than 5%.

    A common misconception about p-values

    Oates (1986) asked the following question to students and senior scientists:

    1
    2
    3
    You have a p-value of .01. Is the following statement true, or false?

    You know, if you decide to reject the null hypothesis, the probability that you are making the wrong decision.

    The answer is “false” (you will learn why it’s false below). But 86% of all professors and lecturers in the sample who were teaching statistics (!) answered this question erroneously with “true”. Gigerenzer, Kraus, and Vitouch replicated this result in 2000 in a German sample (here, the “statistics lecturer” category had 73% wrong). Hence, it is a wide-spread error to confuse the p-value with the false discovery rate.

    The False Discovery Rate (FDR) and the Positive Predictive Value (PPV)

    To answer the question “What’s the probability that a significant p-value indicates a true effect?”, we have to look at the positive predictive value (PPV) of a significant p-value. The PPV indicates the proportion of significant p-values which indicate a real effect amongst all significant p-values. Put in other words: Given that a p-value is significant: What is the probability (in a frequentist sense) that it stems from a real effect?

    (The false discovery rate simply is 1-PPV: the probability that a significant p-value stems from a population with null effect).

    That is, we are interested in a conditional probability Prob(effect is real | p-value is significant).
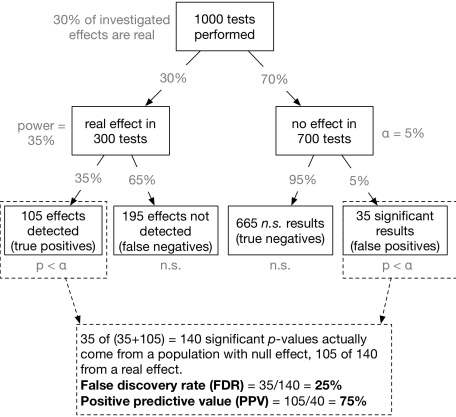
    Inspired by Colquhoun (2014) one can visualize this conditional probability in the form of a tree-diagram (see below). Let’s assume, we carry out 1000 experiments for 1000 different research questions. We now have to make a couple of prior assumptions (which you can make differently in the app we provide below). For now, we assume that 30% of all studies have a real effect and the statistical test used has a power of 35% with an α level set to 5%. That is of the 1000 experiments, 300 investigate a real effect, and 700 a null effect. Of the 300 true effects, 0.35300 = 105 are detected, the remaining 195 effects are non-significant false-negatives. On the other branch of 700 null effects, 0.05700 = 35 p-values are significant by chance (false positives) and 665 are non-significant (true negatives).
    This path is visualized here (completely inspired by Colquhoun, 2014):

    Now we can compute the false discovery rate (FDR): 35 of (35+105) = 140 significant p-values actually come from a null effect. That means, 35/140 = 25% of all significant p-values do not indicate a real effect! That is much more than the alleged 5% level.


    Contribution from :http://www.r-bloggers.com/whats-the-probability-that-a-significant-p-value-indicates-a-true-effect/

    主成份分析、因子分析和聚类分析的异同点

    Posted on 2015-11-11 | In Bioinformatics | Comments: | Views: ℃
    | Words count in article: | Reading time ≈

    基本介绍

    主成分分析就是将多项指标转化为少数几项综合指标,用综合指标来解释多变量的方差- 协方差结构。综合指标即为主成分。所得出的少数几个主成分,要尽可能多地保留原始变量的信息,且彼此不相关。

    因子分析是研究如何以最少的信息丢失,将众多原始变量浓缩成少数几个因子变量,以及如何使因子变量具有较强的可解释性的一种多元统计分析方法。

    聚类分析是依据实验数据本身所具有的定性或定量的特征来对大量的数据进行分组归类以了解数据集的内在结构,并且对每一个数据集进行描述的过程。其主要依据是聚到同一个数据集中的样本应该彼此相似,而属于不同组的样本应该足够不相似。

    三种分析方法既有区别也有联系,本文力图将三者的异同进行比较,并举例说明三者在实际应用中的联系,以期为更好地利用这些高级统计方法为研究所用有所裨益。

    基本思想的异同

    共同点

    主成分分析法和因子分析法都是用少数的几个变量(因子) 来综合反映原始变量(因子) 的主要信息,变量虽然较原始变量少,但所包含的信息量却占原始信息的85 %以上,所以即使用少数的几个新变量,可信度也很高,也可以有效地解释问题。并且新的变量彼此间互不相关,消除了多重共线性。这两种分析法得出的新变量,并不是原始变量筛选后剩余的变量。在主成分分析中,最终确定的新变量是原始变量的线性组合,如原始变量为x1 ,x2 ,. . . ,x3 ,经过坐标变换,将原有的p个相关变量xi 作线性变换,每个主成分都是由原有p 个变量线性组合得到。在诸多主成分Zi 中,Z1 在方差中占的比重最大,说明它综合原有变量的能力最强,越往后主成分在方差中的比重也小,综合原信息的能力越弱。因子分析是要利用少数几个公共因子去解释较多个要观测变量中存在的复杂关系,它不是对原始变量的重新组合,而是对原始变量进行分解,分解为公共因子与特殊因子两部分。公共因子是由所有变量共同具有的少数几个因子;特殊因子是每个原始变量独自具有的因子。对新产生的主成分变量及因子变量计算其得分,就可以将主成分得分或因子得分代替原始变量进行进一步的分析,因为主成分变量及因子变量比原始变量少了许多,所以起到了降维的作用,为我们处理数据降低了难度。

    聚类分析的基本思想是: 采用多变量的统计值,定量地确定相互之间的亲疏关系,考虑对象多因素的联系和主导作用,按它们亲疏差异程度,归入不同的分类中一元,使分类更具客观实际并能反映事物的内在必然联系。也就是说,聚类分析是把研究对象视作多维空间中的许多点,并合理地分成若干类,因此它是一种根据变量域之间的相似性而逐步归群成类的方法,它能客观地反映这些变量或区域之间的内在组合关系[3 ]。聚类分析是通过一个大的对称矩阵来探索相关关系的一种数学分析方法,是多元统计分析方法,分析的结果为群集。对向量聚类后,我们对数据的处理难度也自然降低,所以从某种意义上说,聚类分析也起到了降维的作用。

    不同之处

    主成分分析是研究如何通过少数几个主成分来解释多变量的方差一协方差结构的分析方法,也就是求出少数几个主成分(变量) ,使它们尽可能多地保留原始变量的信息,且彼此不相关。它是一种数学变换方法,即把给定的一组变量通过线性变换,转换为一组不相关的变量(两两相关系数为0 ,或样本向量彼此相互垂直的随机变量) ,在这种变换中,保持变量的总方差(方差之和) 不变,同时具有最大方差,称为第一主成分;具有次大方差,称为第二主成分。依次类推。若共有p 个变量,实际应用中一般不是找p 个主成分,而是找出m (m < p) 个主成分就够了,只要这m 个主成分能反映原来所有变量的绝大部分的方差。主成分分析可以作为因子分析的一种方法出现。

    因子分析是寻找潜在的起支配作用的因子模型的方法。因子分析是根据相关性大小把变量分组,使得同组内的变量之间相关性较高,但不同的组的变量相关性较低,每组变量代表一个基本结构,这个基本结构称为公共因子。对于所研究的问题就可试图用最少个数的不可测的所谓公共因子的线性函数与特殊因子之和来描述原来观测的每一分量。通过因子分析得来的新变量是对每个原始变量进行内部剖析。因子分析不是对原始变量的重新组合,而是对原始变量进行分解,分解为公共因子和特殊因子两部分。具体地说,就是要找出某个问题中可直接测量的具有一定相关性的诸指标,如何受少数几个在专业中有意义、又不可直接测量到、且相对独立的因子支配的规律,从而可用各指标的测定来间接确定各因子的状态。因子分析只能解释部分变异,主成分分析能解释所有变异。

    聚类分析算法是给定m 维空间R 中的n 个向量,把每个向量归属到k 个聚类中的某一个,使得每一个向量与其聚类中心的距离最小。聚类可以理解为: 类内的相关性尽量大,类间相关性尽量小。聚类问题作为一种无指导的学习问题,目的在于通过把原来的对象集合分成相似的组或簇,来获得某种内在的数据规律。

    从三类分析的基本思想可以看出,聚类分析中并没于产生新变量,但是主成分分析和因子分析都产生了新变量。

    数据标准化的比较

    主成分分析中为了消除量纲和数量级,通常需要将原始数据进行标准化,将其转化为均值为0方差为1 的无量纲数据。而因子分析在这方面要求不是太高,因为在因子分析中可以通过主因子法、加权最小二乘法、不加权最小二乘法、重心法等很多解法来求因子变量,并且因子变量是每一个变量的内部影响变量,它的求解与原始变量是否同量纲关系并不太大,当然在采用主成分法求因子变量时,仍需标准化。不过在实际应用的过程中,为了尽量避免量纲或数量级的影响,建议在使用因子分析前还是要进行数据标准化。在构造因子变量时采用的是主成分分析方法,主要将指标值先进行标准化处理得到协方差矩阵,即相关矩阵和对应的特征值与特征向量,然后构造综合评价函数进行评价。

    聚类分析中如果参与聚类的变量的量纲不同会导致错误的聚类结果。因此在聚类过程进行之前必须对变量值进行标准化,即消除量纲的影响。不同方法进行标准化,会导致不同的聚类结果要注意变量的分布。如果是正态分布应该采用z 分数法。

    应用中的优缺点比较

    主成分分析

    优点:首先它利用降维技术用少数几个综合变量来代替原始多个变量,这些综合变量集中了原始变量的大部分信息。其次它通过计算综合主成分函数得分,对客观经济现象进行科学评价。再次它在应用上侧重于信息贡献影响力综合评价。
    缺点:当主成分的因子负荷的符号有正有负时,综合评价函数意义就不明确。命名清晰性低。

    因子分析

    优点:第一它不是对原有变量的取舍,而是根据原始变量的信息进行重新组合,找出影响变量的共同因子,化简数据;第二,它通过旋转使得因子变量更具有可解释性,命名清晰性高。
    缺点:在计算因子得分时,采用的是最小二乘法,此法有时可能会失效。

    聚类分析

    优点:聚类分析模型的优点就是直观,结论形式简明。
    缺点:在样本量较大时,要获得聚类结论有一定困难。由于相似系数是根据被试的反映来建立反映被试间内在联系的指标,而实践中有时尽管从被试反映所得出的数据中发现他们之间有紧密的关系,但事物之间却无任何内在联系,此时,如果根据距离或相似系数得出聚类分析的结果,显然是不适当的,但是,聚类分析模型本身却无法识别这类错误。
    Contribution from :http://blog.sina.com.cn/s/blog_66d362d70101fiuj.html

    R中cluster包进行聚类分析

    Posted on 2015-11-11 | In R | Comments: | Views: ℃
    | Words count in article: | Reading time ≈

    Description

    Methods for Cluster analysis. Much extended the original from Peter Rousseeuw, Anja Struyf and Mia Hubert, based on Kaufman and Rousseeuw (1990) ``Finding Groups in Data’’.
    聚类分析:按照个体或样品(individuals, objects or subjects)的特征将它们分类,使同一类别内的个体具有尽可能高的同质性(homogeneity),而类别之间则应具有尽可能高的异质性(heterogeneity)。
    Cluster analysis or clustering is the task of grouping a set of objects in such a way that objects in the same group (called a cluster) are more similar (in some sense or another) to each other than to those in other groups (clusters). It is a main task of exploratory data mining, and a common technique for statistical data analysis, used in many fields, including machine learning, pattern recognition, image analysis, information retrieval, and bioinformatics.

    Typical cluster models

    • Connectivity models: for example hierarchical clustering builds models based on distance connectivity.
    • Centroid models: for example the k-means algorithm represents each cluster by a single mean vector.
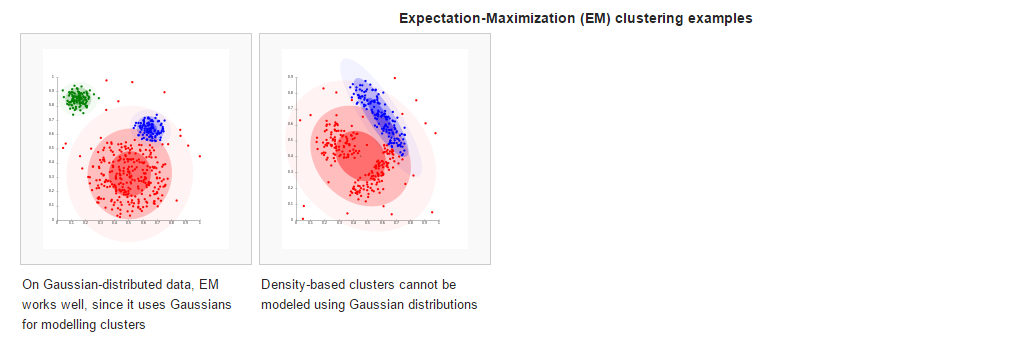
    • Distribution models: clusters are modeled using statistical distributions, such as multivariate normal distributions used by the Expectation-maximization algorithm.
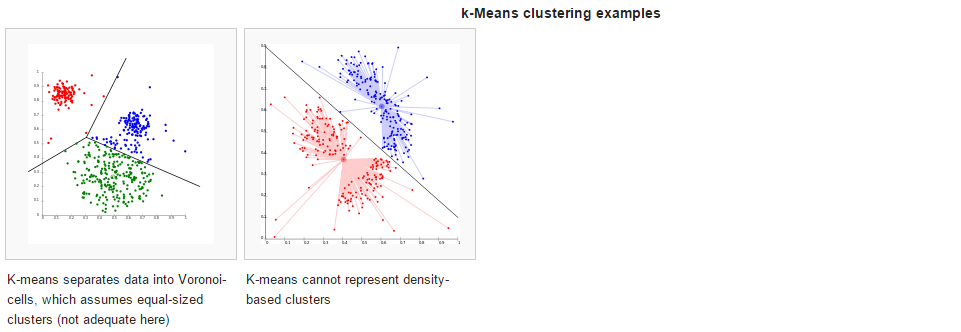
    • Density models: for example DBSCAN and OPTICS defines clusters as connected dense regions in the data space.
    • Subspace models: in Biclustering (also known as Co-clustering or two-mode-clustering), clusters are modeled with both cluster members and relevant attributes.
    • Group models: some algorithms do not provide a refined model for their results and just provide the grouping information.
    • Graph-based models: a clique, i.e., a subset of nodes in a graph such that every two nodes in the subset are connected by an edge can be considered as a prototypical form of cluster. Relaxations of the complete connectivity requirement (a fraction of the edges can be missing) are known as quasi-cliques, as in the HCS clustering algorithm.

    • Algorithms

      Connectivity based clustering (hierarchical clustering)

      Connectivity based clustering, also known as hierarchical clustering, is based on the core idea of objects being more related to nearby objects than to objects farther away. These algorithms connect “objects” to form “clusters” based on their distance. A cluster can be described largely by the maximum distance needed to connect parts of the cluster. At different distances, different clusters will form, which can be represented using a dendrogram, which explains where the common name “hierarchical clustering” comes from: these algorithms do not provide a single partitioning of the data set, but instead provide an extensive hierarchy of clusters that merge with each other at certain distances. In a dendrogram, the y-axis marks the distance at which the clusters merge, while the objects are placed along the x-axis such that the clusters don’t mix.

      Centroid-based clustering

      In centroid-based clustering, clusters are represented by a central vector, which may not necessarily be a member of the data set. When the number of clusters is fixed to k, k-means clustering gives a formal definition as an optimization problem: find the k cluster centers and assign the objects to the nearest cluster center, such that the squared distances from the cluster are minimized.

      Distribution-based clustering

      The clustering model most closely related to statistics is based on distribution models. Clusters can then easily be defined as objects belonging most likely to the same distribution. A convenient property of this approach is that this closely resembles the way artificial data sets are generated: by sampling random objects from a distribution.

      Density-based clustering

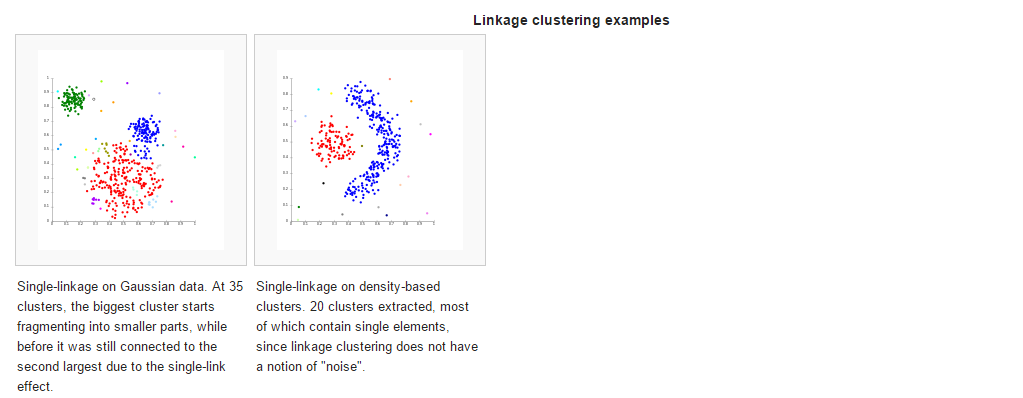
      The most popular density based clustering method is DBSCAN. In contrast to many newer methods, it features a well-defined cluster model called “density-reachability”. Similar to linkage based clustering, it is based on connecting points within certain distance thresholds. However, it only connects points that satisfy a density criterion, in the original variant defined as a minimum number of other objects within this radius.

      综上内容看出其和主成份分析(Principal component analysis,PCA)有较多相似性,所以开始前先对主成份分析、因子分析和聚类分析的异同点进行比较分析,具体关于PCA分析可看本博博文PCA分析。

      R中进行聚类分析

      cluster包

      1
      2
      3
      4
      5
      6
      7
      8
      9
      10
      11
      12
      13
      14
      15
      16
      > library(cluster)
      > #载入所需数据
      > data(votes.repub)
      > votes.diss <- daisy(votes.repub)
      > pamv <- pam(votes.diss, 2, diss = TRUE)
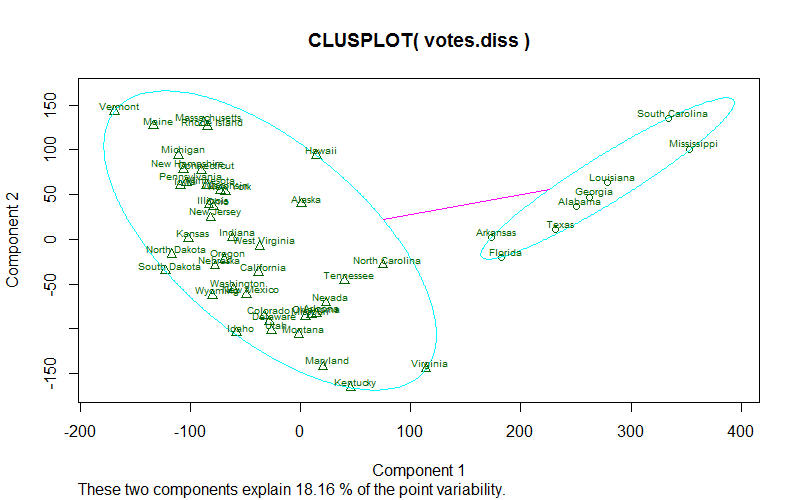
      > clusplot(pamv, shade = TRUE)
      > ## is the same as
      > votes.clus <- pamv$clustering
      > clusplot(votes.diss, votes.clus, diss = TRUE, shade = TRUE)
      > ##Remove the dotted line
      > clusplot(votes.diss, votes.clus, diss = TRUE)
      > ## show label
      > op <- par(new=TRUE, cex = 0.6)
      > clusplot(votes.diss, votes.clus, diss = TRUE,
      + axes=FALSE,ann=FALSE, sub="", col.p=NA, col.txt="dark green", labels=3)
      > par(op)


      参数解释:
      daisy:Dissimilarity Matrix(相异度矩阵)Calculation,compute all the pairwise dissimilarities (distances) between observations in the data set.
      相异度矩阵:相异度矩阵是对象—对象结构的一种数据表达方式,多数聚类算法都是建立在相异度矩阵基础上,如果数据是以数据矩阵形式给出的,就要将数据矩阵转化为相异度矩阵。对象间的相似度或相异度是基于两个对象间的距离来计算的。

      1
      daisy(x, metric = c("euclidean", "manhattan", "gower"),stand = FALSE, type = list(), weights = rep.int(1, p))

      x—numeric matrix or data frame, of dimension n*p.
      metric—“euclidean” (the default), “manhattan” and “gower”.Euclidean distances are root sum-of-squares of differences, and manhattan distances
      are the sum of absolute differences.”Gower’s distance” is chosen by metric “gower” or automatically if some columns of x are not numeric.
      stand—logical flag: if TRUE, then the measurements in x are standardized before calculating the dissimilarities. Measurements are standardized for each variable (column), by subtracting the variable’s mean value and dividing by the variable’s mean absolute deviation.
      pam:Partitioning (clustering) of the data into k clusters “around medoids”, a more robust version of K-means.

      1
      2
      3
      4
      5
      6
      pam(x, k, diss = inherits(x, "dist"), metric = "euclidean",
      medoids = NULL, stand = FALSE, cluster.only = FALSE,
      do.swap = TRUE,
      keep.diss = !diss && !cluster.only && n < 100,
      keep.data = !diss && !cluster.only,
      pamonce = FALSE, trace.lev = 0)

      x—data matrix or data frame, or dissimilarity matrix or object.In case of a dissimilarity matrix, x is typically the output of daisy or dist.
      k—positive integer specifying the number of clusters, less than the number of observations.
      diss—logical flag: if TRUE (default for dist or dissimilarity objects), then x will be considered as a dissimilarity matrix. If FALSE, then x will be considered as a matrix of observations by variables.
      metric—“euclidean” and “manhattan”,If x is already a dissimilarity matrix, then this argument will be ignored.
      clusplot:Bivariate Cluster Plot (clusplot) Default Method

      1
      2
      3
      4
      5
      6
      7
      8
      9
      10
      11
      12
      13
      14
      15
      clusplot(x, clus, diss = FALSE,
      s.x.2d = mkCheckX(x, diss), stand = FALSE,
      lines = 2, shade = FALSE, color = FALSE,
      labels= 0, plotchar = TRUE,
      col.p = "dark green", col.txt = col.p,
      col.clus = if(color) c(2, 4, 6, 3) else 5, cex = 1, cex.txt = cex,
      span = TRUE,
      add = FALSE,
      xlim = NULL, ylim = NULL,
      main = paste("CLUSPLOT(", deparse(substitute(x)),")"),
      sub = paste("These two components explain",
      round(100 * var.dec, digits = 2), "% of the point variability."),
      xlab = "Component 1", ylab = "Component 2",
      verbose = getOption("verbose"),
      ...)

      x—data matrix or data frame, or dissimilarity matrix or object.In case of a dissimilarity matrix, x is typically the output of daisy or dist.
      clus—clus is often the clustering component of the output of pam.
      diss—logical flag: if TRUE (default for dist or dissimilarity objects), then x will be considered as a dissimilarity matrix. If FALSE, then x will be considered as a matrix of observations by variables.
      lines—lines = 0, no distance lines will appear on the plot;lines = 1, the line segment between m1 and m2 is drawn;lines = 2, a line segment between the boundaries of E1 and E2 is drawn (along the line connecting m1 and m2).
      shade—logical flag: if TRUE, then the ellipses are shaded in relation to their density.
      color—logical flag: if TRUE, then the ellipses are colored with respect to their density.labels—labels= 0, no labels are placed in the plot;
      labels= 1, points and ellipses can be identified in the plot (see identify);labels= 2, all points and ellipses are labelled in the plot;labels= 3, only the points are labelled in the plot;labels= 4, only the ellipses are labelled in the plot.labels= 5, the ellipses are labelled in the plot, and points can be identified.
      col.p—color code(s) used for the observation points.

      更多资源

      https://cran.r-project.org/web/views/Cluster.html

      批量求fasta格式序列长度

      Posted on 2015-11-08 | In Linux | Comments: | Views: ℃
      | Words count in article: | Reading time ≈

      linux下用awk计算fasta序列的长度
      fasta序列文件data.fa

      1
      2
      3
      4
      5
      6
      7
      8
      >Gorai.004G111100.1
      ATGGGTACTGCTCCAACCCAGTGCCCTTCTGGAATCACTGCAAATTTCCACGCCAAATTTGATAACAGAACTGAGTTTTC
      >Gorai.004G111100.2
      ATGTTTTTCATGCTCCGGTGGACAAGATACTCTGGGATGCCGGGGAACAGTTTTTCCTTTTCTTGGCAGACATATGCACATAAAATTCTT
      >Gorai.004G111100.3
      ATGGGTACTGCTCCAACCCAGTGCCCTTCTGGAATCACTGCAAATTTCCAC
      >Gorai.004G111100.4
      ATGGGAATGCATGAACTAGCAGCCAAAGTTGATGAGT

      首先将fasta序列转换成一行显示,命令如下:

      1
      awk '/^>/&&NR>1{print "";}{ printf "%s",/^>/ ? $0"%":$0 }'  data.fa >data2.fa

      结果:

      1
      2
      3
      4
      >Gorai.004G111100.1%ATGGGTACTGCTCCAACCCAGTGCCCTTCTGGAATCACTGCAAATTTCCACGCCAAATTTGATAACAGAACTGAGTTTTC
      >Gorai.004G111100.2%ATGTTTTTCATGCTCCGGTGGACAAGATACTCTGGGATGCCGGGGAACAGTTTTTCCTTTTCTTGGCAGACATATGCACATAAAATTCTT
      >Gorai.004G111100.3%ATGGGTACTGCTCCAACCCAGTGCCCTTCTGGAATCACTGCAAATTTCCAC
      >Gorai.004G111100.4%ATGGGAATGCATGAACTAGCAGCCAAAGTTGATGAGT

      长度计算:

      1
      awk -F"%" '{print $1"\t"length($2)}'  data2.fa >data3.fa

      结果:

      1
      2
      3
      4
      >Gorai.004G111100.1 80
      >Gorai.004G111100.2 90
      >Gorai.004G111100.3 51
      >Gorai.004G111100.4 37

      More: Question: Multiline Fasta To Single Line Fasta

      R中的基础函数

      Posted on 2015-11-08 | In R | Comments: | Views: ℃
      | Words count in article: | Reading time ≈

      在R中偶尔也需要对一些数据进行简短的处理,掌握一些基本函数是必须的,本文将持续收集那些短小精悍的R函数,正确的运用还是能起到四两拔千斤的效果,欢迎评论补充。

      aggregate

      功能:aggregate(formula, data, FUN)
      首先将数据进行分组(按行),然后对每一组数据进行函数统计,最后把结果组合成一个比较nice的表格返回.

      1
      2
      3
      4
      5
      6
      7
      8
      9
      10
      11
      12
      13
      14
      15
      16
      17
      18
      19
      20
      21
      22
      23
      24
      25
      26
      27
      28
      29
      30
      31
      32
      33
      34
      35
      36
      > head(chickwts)
      weight feed
      1 179 horsebean
      2 160 horsebean
      3 136 horsebean
      4 227 horsebean
      5 217 horsebean
      6 168 horsebean
      > unique(chickwts$feed)
      [1] horsebean linseed soybean sunflower meatmeal casein
      Levels: casein horsebean linseed meatmeal soybean sunflower
      > #aggregate(chickwts$weight, by=list(chickwts$feed), FUN=mean)
      > aggregate(weight ~ feed, data = chickwts, mean)
      feed weight
      1 casein 323.5833
      2 horsebean 160.2000
      3 linseed 218.7500
      4 meatmeal 276.9091
      5 soybean 246.4286
      6 sunflower 328.9167
      > head(iris)
      Sepal.Length Sepal.Width Petal.Length Petal.Width Species
      1 5.1 3.5 1.4 0.2 setosa
      2 4.9 3.0 1.4 0.2 setosa
      3 4.7 3.2 1.3 0.2 setosa
      4 4.6 3.1 1.5 0.2 setosa
      5 5.0 3.6 1.4 0.2 setosa
      6 5.4 3.9 1.7 0.4 setosa
      > unique(iris$Species)
      [1] setosa versicolor virginica
      Levels: setosa versicolor virginica
      > aggregate(. ~ Species, data = iris, mean)
      Species Sepal.Length Sepal.Width Petal.Length Petal.Width
      1 setosa 5.006 3.428 1.462 0.246
      2 versicolor 5.936 2.770 4.260 1.326
      3 virginica 6.588 2.974 5.552 2.026

      paste

      功能:paste(…, sep = “ “, collapse = NULL)
      字符串连接

      1
      2
      3
      4
      5
      > paste("CK", 1:6, sep = "")
      [1] "CK1" "CK2" "CK3" "CK4" "CK5" "CK6"
      > #设置collapse参数,连成一个字符串
      > paste("CK", 1:6, sep = "", collapse = "-")
      [1] "CK1-CK2-CK3-CK4-CK5-CK6"

      paste在不指定分割符的情况下,默认分割符是空格 ,paste0在不指定分割符的情况下,默认分割符是空。

      strsplit

      功能:strsplit(x, split, fixed = FALSE, perl = FALSE, useBytes = FALSE)
      字符串拆分,生成一个list
      参数解释:
      x为字串向量,每个元素都将单独进行拆分。
      split为拆分位置的字串向量(分隔符),默认为正则表达式匹配(fixed=FALSE)。如果你没接触过正则表达式,设置fixed=TRUE,表示使用普通文本匹配或正则表达式的精确匹配。普通文本的运算速度快。
      perl=TRUE/FALSE的设置和perl语言版本有关,如果正则表达式很长,正确设置表达式并且使用perl=TRUE可以提高运算速度。
      useBytes设置是否逐个字节进行匹配,默认为FALSE,即按字符而不是字节进行匹配。

      1
      2
      3
      4
      > text <- "Hello Adam!\nHello Ava!"
      > strsplit(text, "\\s")
      [[1]]
      [1] "Hello" "Adam!" "Hello" "Ava!"

      如果要对一个向量使用该函数,需要注意。

      1
      2
      3
      #分割向量的每一个元素,并取分割后的第一个元素
      unlist(lapply(X = c("abc", "bcd", "dfafadf"), FUN = function(x) {return(strsplit(x, split = "")[[1]][1])}))
      [1] "a" "b" "d"

      grep/regexpr/gregexpr/regexec

      功能:grep(pattern, x, ignore.case = FALSE, perl = FALSE, value = FALSE, fixed = FALSE, useBytes = FALSE, invert = FALSE)
      grep仅返回匹配项的下标.
      regexpr、gregexpr和regexec返回的结果包含了匹配的具体位置和字符串长度信息.

      1
      2
      3
      4
      5
      6
      7
      8
      9
      10
      11
      12
      13
      14
      15
      16
      17
      18
      19
      20
      21
      22
      23
      24
      25
      26
      27
      28
      29
      30
      31
      32
      33
      34
      35
      36
      37
      38
      39
      40
      41
      42
      43
      44
      45
      46
      47
      48
      > text <- c("Hellow, Adam!", "Hi, Adam!", "How are you, Adam.")
      > text
      [1] "Hellow, Adam!" "Hi, Adam!" "How are you, Adam."
      > grep("Adam",text)
      [1] 1 2 3
      > regexpr("Adam", text)
      [1] 9 5 14
      attr(,"match.length")
      [1] 4 4 4
      attr(,"useBytes")
      [1] TRUE
      > gregexpr("Adam", text)
      [[1]]
      [1] 9
      attr(,"match.length")
      [1] 4
      attr(,"useBytes")
      [1] TRUE

      [[2]]
      [1] 5
      attr(,"match.length")
      [1] 4
      attr(,"useBytes")
      [1] TRUE

      [[3]]
      [1] 14
      attr(,"match.length")
      [1] 4
      attr(,"useBytes")
      [1] TRUE

      > regexec("Adam", text)
      [[1]]
      [1] 9
      attr(,"match.length")
      [1] 4

      [[2]]
      [1] 5
      attr(,"match.length")
      [1] 4

      [[3]]
      [1] 14
      attr(,"match.length")
      [1] 4

      substr

      功能:substr(x, start, stop)
      字符串提取

      1
      2
      > substr(text,9,12)
      [1] "Adam" "!" "you,"

      strtrim

      功能:strtrim(x, width)
      将字符串修剪到特定的显示宽度.

      1
      2
      3
      4
      5
      6
      7
      8
      9
      10
      11
      12
      13
      14
      15
      16
      17
      18
      19
      > head(iris)
      Sepal.Length Sepal.Width Petal.Length Petal.Width Species
      1 5 3.5 1.4 0.2 setosa
      2 4 3.0 1.4 0.2 setosa
      3 4 3.2 1.3 0.2 setosa
      4 4 3.1 1.5 0.2 setosa
      5 5 3.6 1.4 0.2 setosa
      6 5 3.9 1.7 0.4 setosa
      > strtrim(head(iris)$Sepal.Length,1)
      [1] "5" "4" "4" "4" "5" "5"
      > iris$Sepal.Length<-strtrim(head(iris)$Sepal.Length,1)
      > head(iris)
      Sepal.Length Sepal.Width Petal.Length Petal.Width Species
      1 5 3.5 1.4 0.2 setosa
      2 4 3.0 1.4 0.2 setosa
      3 4 3.2 1.3 0.2 setosa
      4 4 3.1 1.5 0.2 setosa
      5 5 3.6 1.4 0.2 setosa
      6 5 3.9 1.7 0.4 setosa

      length/nchar

      nchar是向量元素的字符个数,而length是向量长度.

      1
      2
      3
      4
      5
      6
      7
      8
      9
      > length("ATGGGAATGCATGAACTAGCAGCCAAAGTTGATGAGT")
      [1] 1
      > car <- c('bmw','ford','mini','bmw','mini')
      > length(car)
      [1] 5
      > length(unique(car))
      [1] 3
      > nchar("ATGGGAATGCATGAACTAGCAGCCAAAGTTGATGAGT")
      [1] 37

      round

      功能:round(x, digits = 0)
      四舍五入

      1
      2
      > round(c(1.1254,0.1247844),3)
      [1] 1.125 0.125

      axes/axis

      axes=FALSE 暂时禁止坐标轴的生成|以便使用axis()函数添加你自己定制的坐标轴。默认情况是axes=TRUE,即包含坐标轴。
      axis(side, . . . )
      在当前图形的指定边上添加坐标,在哪个边上由第一个参数指定(1到4,从底部按照顺时针顺序)。其他参数控制坐标的位置|在图形内或图形外,以及标记的位置和标签。适合在调用参数为axes=FALSE的函数plot()后添加定制的坐标轴。

      order()

      A[order(A[,4],decreasing=T),] #按照第4列降序排序
      data #dataframe对象 含有v1,v2两列
      data[sort(data$v1,index.return=TRUE)$ix,]  #对data的数据按v1排列,v1须为numeric as.numeric()

      %in%

      功能:在数据框中选取某一列只含特定字符的行

      1
      2
      3
      4
      5
      6
      7
      8
      9
      10
      11
      12
      13
      14
      15
      16
      17
      18
      19
      20
      21
      22
      23
      24
      > library(dplyr)
      > library(tidyr)
      > df <- data_frame(
      + group = c(1:2, 1),
      + item_name = c("a", "b", "b"),
      + value1 = 1:3,
      + value2 = 4:6
      + )
      > df
      Source: local data frame [3 x 4]

      group item_name value1 value2
      (dbl) (chr) (int) (int)
      1 1 a 1 4
      2 2 b 2 5
      3 1 b 3 6
      >#选取item_name列中只含有a的行
      > a<-c("a")
      > df[df$item_name %in% a,]
      Source: local data frame [1 x 4]

      group item_name value1 value2
      (dbl) (chr) (int) (int)
      1 1 a 1 4

      table

      功能:统计数据的频数

      1
      2
      3
      4
      5
      > a<-c(1,1,1,2,2,3)
      > table(a)
      a
      1 2 3
      3 2 1

      str()

      功能:查看数据结构

      1
      2
      3
      4
      5
      6
      7
      8
      9
      10
      11
      12
      13
      14
      15
      16
      17
      18
      19
      > str(reps )
      'data.frame': 255956 obs. of 17 variables:
      $ bin : int 585 585 585 585 585 585 585 585 585 585 ...
      $ swScore : int 342 2271 3379 2704 180 380 1113 233 388 673 ...
      $ milliDiv : int 0 159 80 108 0 131 168 302 256 182 ...
      $ milliDel : int 0 37 4 31 0 0 19 0 0 7 ...
      $ milliIns : int 0 25 0 10 0 14 19 68 14 90 ...
      $ genoName : Factor w/ 1 level "chrX": 1 1 1 1 1 1 1 1 1 1 ...
      $ genoStart: int 0 41 1799 2290 2797 2945 3015 3565 5012 5164 ...
      $ genoEnd : int 38 446 2272 2703 2817 3015 3221 3757 5164 5186 ...
      $ genoLeft : int -154913716 -154913308 -154911482 -154911051 -154910937 -154910739 -154910533 -154909997 -154908590 -154908568 ...
      $ strand : Factor w/ 2 levels "-","+": 2 2 2 2 2 2 1 2 1 2 ...
      $ repName : Factor w/ 1105 levels "(A)n","(AAATG)n",..: 90 519 656 579 90 183 248 284 940 240 ...
      $ repClass : Factor w/ 15 levels "DNA","LINE","Low_complexity",..: 10 4 4 4 10 10 11 3 4 11 ...
      $ repFamily: Factor w/ 35 levels "AcHobo","Alu",..: 28 7 7 7 28 28 2 12 13 2 ...
      $ repStart : int 3 741 1 1 2 1 -20 1 -200 1 ...
      $ repEnd : int 40 1150 475 422 21 69 292 179 228 22 ...
      $ repLeft : int 0 -104 -83 -79 0 0 87 0 37 -280 ...
      $ id : int 1 2 3 4 5 6 7 8 9 1 ...

      ifelse

      功能:条件判断

      1
      2
      3
      4
      5
      6
      7
      8
      9
      10
      11
      12
      13
      14
      15
      16
      17
      18
      19
      20
      21
      22
      > set.seed(123)
      > col1 <- runif (5, 0, 2)
      > col2 <- rnorm (5, 0, 2)
      > col3 <- rpois (5, 3)
      > col4 <- rchisq (5, 0.1)
      > df <- data.frame (col1, col2, col3, col4)
      > df
      col1 col2 col3 col4
      1 0.5751550 -3.3791113 5 2.771082e-01
      2 1.5766103 2.4789918 2 3.888853e-04
      3 0.8179538 -0.2179319 0 8.652702e-05
      4 1.7660348 -0.2344839 2 6.492406e-17
      5 1.8809346 0.3661652 6 2.963428e-02
      > output <- ifelse ((df$col1) > 1 & (df$col3) > 2, "yes", "no")
      > df$output <- output
      > df
      col1 col2 col3 col4 output
      1 0.5751550 -3.3791113 5 2.771082e-01 no
      2 1.5766103 2.4789918 2 3.888853e-04 no
      3 0.8179538 -0.2179319 0 8.652702e-05 no
      4 1.7660348 -0.2344839 2 6.492406e-17 no
      5 1.8809346 0.3661652 6 2.963428e-02 yes

      gsub和sub

      字符串替换
      gsub替换匹配到的全部
      sub 替换匹配到的第一个

      1
      2
      3
      4
      5
      6
      # 将b替换为B
      gsub(pattern = "b", replacement = "B", x = c("abcb", "boy", "baby"))
      [1] "aBcB" "Boy" "BaBy
      # 只替换第一个b
      sub(pattern = "b", replacement = "B", x = c("abcb", "baby"))
      [1] "aBcb" "Baby"

      字符串中字符统计

      1
      2
      3
      4
      5
      6
      7
      s <- "aababac"
      p <- "a"
      countCharOccurrences <- function(char, s) {
      s2 <- gsub(char,"",s)
      return (nchar(s) - nchar(s2))
      }
      countCharOccurrences(p,s)
      1…101112…15
      tiramisutes

      tiramisutes

      hope bioinformatics blog
      148 posts
      17 categories
      112 tags
      RSS
      GitHub E-Mail Weibo Twitter
      Creative Commons
      Links
      • qRT-PCR-Pipeline
      • GitBook《awk学习总结》
      • 棉花遗传改良团队
      • 生信菜鸟团-深圳大学城
      • 生信技能树
      • rabbit gao's blog
      • Huans(代谢+GWAS)
      • NSC-sequenceing
      • 伯乐在线
      • Linux开源中文社区
      • R-bloggers
      • R-resource
      • ggplot2
      • pele' blog
      © 2014 – 2023 tiramisutes
      Powered: Hexo
      |
      ▽ – NexT.Muse
      The total visits  times
      0%